Download
1 / 73
730 likes | 931 Vues
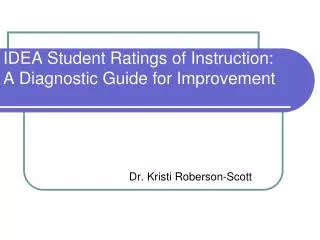
IDEA Student Ratings of Instruction: A Diagnostic Guide for Improvement. Dr. Kristi Roberson-Scott. Purpose of Presentation. Interpretation of the Student Ratings of Instruction Forms Reports Interpreting the Diagnostic Form Report for Improved Teaching Effectiveness.

E N D
IDEA Student Ratings of Instruction: A Diagnostic Guide for Improvement Dr. Kristi Roberson-Scott
Purpose of Presentation • Interpretation of the Student Ratings of Instruction • Forms • Reports • Interpreting the Diagnostic Form Report for Improved Teaching Effectiveness
IDEA is an acronym for.. • Individual Development and Educational Assessment
IDEA Uses • IDEA system • Should be able to use IDEA for ID = Individual Development • Should be able to use IDEA for EA= Educational Assessment
Improvement of Student Learning • Student Ratings can have a positive impact if... • The instrument • Is “learning focused” • Provides a diagnostic • The emphasis for “summative” faculty evaluation is appropriate • 30%-50% of the overall evaluation of teaching • Results are not over-interpreted • Faculty trust the process
IDEA: What you should know about the student ratings • Reliability and validity of the IDEA system • How to interpret IDEA reports and use IDEA resources for faculty improvement plans • How to interpret and adjusted vs. unadjusted scores • How to use group summary reports for program improvement
IDEA: What you should know about the student ratings • How to complete the FIF • How to interpret the reports • How to use IDEA reports to improve teaching effectiveness • How to use IDEA resources to improve teaching • Student ratings are data that must be interpreted
Student Ratings- Reliable? Valid? • In general, student ratings tend to be statistically reliable, valid and relatively free from bias (probably more so than other data used to evaluate teaching) • Reliability – the likelihood that you will get the same results if the survey is administered again to the same group of students • Validity – measures what it supposed to/intended to measure
Reliability & Validity Dog, Saul T. IDEA University Spring 2007 Composition I 1010 (MWF – 10:00) There were 12 students enrolled in the course and 9 students responded. Your results are considered unreliable because the number responding is so Small. The 75% response rate indicates that results are representative of the class as a whole. • < 10 students Unreliable • 10-14 students Marginally Reliable • 15-24 Fairly Reliable • 25-39 Reliable • >30 Highly Reliable
Understanding the value of the IDEA System’s uniqueness? • Student Learning Focus • Diagnostic Component • Scores Adjusted for Extraneous Influences • What was instructor’s influence on learning? • Documented Validity and Reliability • National Comparative Data • Group Summary Reports • Program Assessment
IDEA as a Diagnostic to Guide Improvement And as a Tool to Evaluate Teaching Effectiveness
Underlying Assumptions • Students are not qualified to assess: • Faculty expertise • Appropriateness of goals, content, and organization of course • Materials used in delivery • How student work is evaluated, including grading practices
Underlying Assumptions • Nor are they qualified to assess “indirect” contributions to instruction • Support for departmental efforts • Assistance to colleagues • Contributing to a positive atmosphere
IDEA Student Ratings of Instruction The Student Learning Model
Student Learning Model • Types of learning must reflect instructor’s purpose • Effectiveness determined by student progress on objectives stressed by instructor
Student Learning Model • Specific teaching behaviors influence certain types of student progress under certain circumstances.
IDEA Student Ratings of Instruction- Forms Faculty Information Form Student Survey Diagnostic Form
IDEA: FIF Faculty Information Form
Faculty Information Form • One FIF per class being evaluated • Course Information • IDEA Department Codes • Extended list: http://www.idea.ksu.edu/StudentRatings/deptcodes.html • 12 Learning Objectives • Course Description Items • Best answered toward end of semester
FIF: Selecting Objectives • 3-5 as “Essential” or “Important” • Is it a significant part of the course? • Do you do something specific to help students accomplish the objective? • Does the student’s progress on the objective influence his or her grade? • In general, progress ratings are negatively related to the number of objectives chosen. • Research Note 3
Relevant Objectives • Basic Cognitive • Items 1, 2 • Applications of Learning • Items 3, 4 • Expressiveness • Items 6, 8
Relevant Objectives • Intellectual Development • 7, 10, 11 • Lifelong Learning • 9, 12 • Team skills • 5
Best Practices • Multi-section courses • Curriculum committee review • Prerequisite-subsequent courses • Incorporate into course syllabus
Best Practices • Discuss meaning of objectives with students • Early in semester • Inform that will be asked to rate their own progress on objectives • Reflect on their understanding of course purpose and how parts of course fit the 12 objectives • Discuss differences in perception of objectives’ meaning
Student Survey Diagnostic Form
Student Survey: Diagnostic Form • Teaching Methods: Items 1-20 • Learning Objectives: Items 21-32 • Student and Course • Student Characteristics: Items 36-39, 43 • Course Management/Content: Items 33-35 • Global Summary: Items 40-42 • Experimental Items: Items 44-47 • Extra Questions: Items 48-67 • Comments
False Assumptions • Effective instructors effectively employ all 20 teaching methods. • The 20 teaching methods items are used to make an overall judgment about teaching effectiveness. • Students should make significant progress on all 12 learning objectives
Using Extra Questions • 20 Extra Questions available • May be used to address questions at various levels: • Institution • Department • Course • Or all three
Student Survey • How to use extra questions • Comments • Constructive
ReportBackground Comparison Groups Converted Scores
The Report: Comparative Information • Comparison Groups • IDEA • Discipline • Institution
Comparison Groups (norms) • IDEA Comparisons • Classes rated in 1998-99, 1999-2000, 2000-2001 • Diagnostic Form • Exclude first time institutions • Exclude classes with fewer than 10 students • No one institution comprises more than 5% of the database • 128 institutions • 44,455 classes
Comparison Groups (norms) • Discipline Comparisons • Most recent 5 years of data 2000-2005 • Minimum of 400 classes • Exclusions same as IDEA Comparisons • Also exclude classes with no objectives selected
Comparison Groups (norms) • Institutional Comparisons • Minimum of 400 classes • Most recent 5 years of data • Exclude classes with no objectives selected • Include all class sizes
Report: Types of Scores • Average Scores – Numerical averages on a 5-point scale • Converted Scores – Compensate for different averages among course objectives and provide normative comparisons • Raw Scores – unadjusted scores • Adjusted scores – Compensate for extraneous factors beyond instructor’s control, .. “level the playing field”
Converted Scores- WHY? • Method of standardizing scores with different averages and standard deviations • Able to compare scores on the same scale
Converted Averages • In classes where “Gaining Factual Knowledge” was an I or E Objective the average student rating of progress was 4.00 (5-point scale) • In classes where “Gaining a broader understanding of intellectual/cultural activity” was an I or E objective, the average rating of progress was 3.69 • If only 5-point averages are considered, those choosing the second objective would be at a disadvantage
Norms: Converted Averages • Method of standardizing scores with different averages and standard deviations • Able to compare scores on the same scale • Use T Scores • Average = 50 • Standard Deviation = 10 • These are not percentiles
What do the converted ratings mean? • Much Higher >63 score (highest 10%) • Higher 56-62 (next 20 percent – 71-90%) • Similar 45-55 (middle 40% of courses 31-70%) • Lower 38-44 (next 20 percent (11-30%) • Much Lower <37 (lowest ten percent)
Adjusted Scores • Control for factors beyond instructor’s control • Regression equations
Adjusted Scores: Diagnostic Form • Student Motivation (#39) • Student Work Habits (#43) • Class Size (Enrollment, FIF) • Course Difficulty (multiple items) • Student Effort (multiple items)
Gaining Factual Knowledge – Average Progress Ratings Work Habits (Item 43) Student Motivation (Item 39) Low Low Avg. Avg. High Avg. High Low 3.51 3.66 3.80 3.95 4.08 Low Avg. 3.60 3.76 3.91 4.05 4.07 Average 3.73 3.87 4.02 4.12 4.21 High Avg. 3.88 3.97 4.13 4.23 4.33 High 4.01 4.12 4.25 4.33 4.48 Impact of Extraneous Factors Technical Report 12, page 40
The IDEA Report • Diagnostic Form Report • What were students’ perceptions of the course and their learning? • What might I do to improve my teaching?
The Report: Questions • What was the response rate and how reliable is the information contained in the report? • What overall estimates of my teaching effectiveness were made by students? • What is the effect of “adjusting” these measures to take into consideration factors I can’t control? • How do my scores compare to other comparison groups?
Summary Evaluation of Teaching Effectiveness 50% 25% 25%