Bloomberg
Bloomberg. Guido Riolo Ichimoku Kinko Hyo. Focus Day Budapest , 18 th November 2010. Bloomberg. Objectives of this presentation:. To demystify the presumed complexity of Ichimoku. To explore some of the most commonly used signals generated by this “at a glance” chart.


Bloomberg
E N D
Presentation Transcript
Bloomberg Guido Riolo Ichimoku Kinko Hyo Focus Day Budapest, 18thNovember 2010
Bloomberg Objectives of this presentation: To demystify the presumed complexity of Ichimoku To explore some of the most commonly used signals generated by this “at a glance” chart Draw comparisons with other TA studies and techniques Worth remembering: Some of these signals can be better suited to your style and needs than others Personally, timing signals are less useful than trend following and confirmations
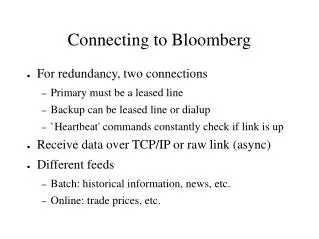
Bloomberg Calculation of Lane’s Stochastics Lane’s Stochastics is concerned with the sustainability of extreme prices Once the indicator goes into OB or OS, the inability to sustain the move is identified by the indicator coming out of extreme territory Highest high in the last 9 bars = 100% 9-bar stochastics: H-C * 100 H-L Lowest low in the last 9 bars = 0%
Bloomberg Ichimoku is concerned with areas of equilibrium The first such area is the Conversion line, the medium point in the last 9 bars The second area is the Base line, the medium point in the last 26 bars. They are the price levels which would cause a 9 bar and a 26 bar stochastic line to be at 50% Highest high in the last 9 bars 9-bar conversion line: H-L + L 2 Lowest low in the last 9 bars
Bloomberg When current price diverges too much from the short term area of equilibrium, the Conversion line, the ensuing mean reverting correction tends to have a target in one of the areas of equilibrium
Bloomberg This could also be done with traditional moving averages, why use the Conversion and Base lines? Following a breakout from their ranges (9 and 26 bars), 50% of the new move contributes to the value of the lines. This emulates the responsiveness of a 3-bar EMA During a range-bound market, they remain flat The simplicity of calculation makes them preferable to variable period MAs But the comparison with MAs doesn’t stop there. Crossovers between Conversion and Base can be used for signals.
Bloomberg This could also be done with traditional moving averages, why use the Conversion and Base lines? Following a breakout from their ranges (9 and 26 bars), 50% of the new move contributes to the value of the lines. This emulates the responsiveness of a 3-bar EMA During a range-bound market, they remain flat The simplicity of calculation makes them preferable to variable period MAs But the comparison with MAs doesn’t stop there. Crossovers between Conversion and Base can be used for signals. Crossovers not ideal as signals: similar drawbacks as MA crossovers, plus lines can overlap for a significant period of time.
Bloomberg One of the most distinctive and useful component of an Ichimoku chart is the Cloud, the shaded area between the next two lines we will consider. The Leading Span 1 is the midpoint between base and conversion and represents a summary of short and medium term equilibria The Leading Span 2 is the midpoint in the last 52 bars and represents long term equilibrium The Leading Spans are called this way because they are projected forward 26 periods. Markets have memory and this allows the comparison of today’s price versus the areas of equilibrium 26 periods ago
Bloomberg Summary of lines: Conversion: Short term area of equilibrium. Base: medium term area of equilibrium. Leading Span 1: Summary of short term and medium term areas of equilibrium. By shifting it in the future we are comparing the current price with the level 26 periods ago. Leading Span 2: Long term area of equilibrium. By shifting it in the future we are comparing the current price with the level 26 periods ago. Lagging Span: Current price. By shifting it in the past we are comparing the current price with the leading spans 52 periods ago. So what’s my favourite? Modified Kumo
Bloomberg Kumo Breakout trading: “Kumo Trading is the purest form of trend trading offered by the Ichimoku charting system, as it looks solely to the kumo and price's relationship to it for its signals. It is "big picture" trading that focuses only on whether price is trading above or below the prevailing kumo. In a nutshell, the signal to go long in Kumo breakout trading is when price closes above the prevailing kumo and, likewise, the signal to go short is when price closes below the prevailing kumo.” From: http://www.kumotrader.com/ichimoku_wiki/index.php?title=Ichimoku_trading_ strategies#Kumo_Breakout Modified Kumo: Price and Lagging Span should be on the same side of the Cloud (Kumo). When they are, the trend is defined. When they are not, you look at the last time they were in agreement and that is the current prevailing trend. The Cloud is an area of turbulence. When the price or the Lagging Span interact with it, their course is distorted and corrections or inversions become more likely. Price, Conversion, Base, Leading Span 1 and Leading Span 2 should all be lined up. The more conditions are met, the greater conviction in the trend. Superior to ADX in my opinion, since levels of trend can be ranked. Price can correct to any of the other lines, depending on the degree of the correction. Lagging Span does not correct on the Conversion.
Bloomberg Area of turbulence
Bloomberg Pullback: Retest of the support Breakout
Bloomberg Market rallies from last level of support Are we out of the woods yet? Dotcom bubble: price breaks under the cloud.. But the Lagging Span fails to confirm.. Third wave of corrective pattern breaks the monthly support
Bloomberg Contact Details: Guido Riolo<MSG> on Bloomberg guidoriolo@bloomberg.net +4420 7330 7211 All opinions expressed are my own and do not reflect the opinions of my employer. All examples used and indications given are for educational purposes only and are not meant to be an indication to buy, sell or otherwise trade any security. All indicators will occasionally give false trading signals and they should only be used after careful consideration of their behaviour and of their possible consequences.