Download

1 / 56
560 likes | 735 Vues
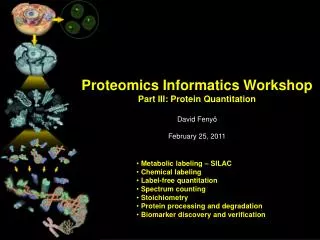
Proteomics Informatics Workshop Part III: Protein Quantitation David Fenyö February 25, 2011. Metabolic labeling – SILAC Chemical labeling Label-free quantitation Spectrum counting Stoichiometry Protein processing and degradation Biomarker discovery and verification.

E N D
Proteomics Informatics Workshop Part III: Protein Quantitation David Fenyö February 25, 2011 • Metabolic labeling – SILAC • Chemical labeling • Label-free quantitation • Spectrum counting • Stoichiometry • Protein processing and degradation • Biomarker discovery and verification
Proteomics Informatics MS/MS Biological System Experimental Design Samples Sample Preparation MS Measurements Data Analysis What does the sample contain? How much? What does the sample contain? How much? Information about each sample Information Integration Information about the biological system
Proteomic Bioinformatics – Quantitation Sample i Protein j Peptide k Lysis Fractionation Digestion MS LC-MS
Quantitation – Label-Free (Standard Curve) Sample i Protein j Peptide k Lysis Fractionation Digestion LC-MS MS
Quantitation – Label-Free (MS) Sample i Protein j Peptide k Lysis Assumption: constant for all samples Fractionation Digestion LC-MS MS MS
Quantitation – Metabolic Labeling Light Heavy Lysis Assumption: All losses after mixing are identical for the heavy and light isotopes and Fractionation Digestion LC-MS Sample i Protein j Peptide k MS H L Oda et al. PNAS 96 (1999) 6591 Ong et al. MCP 1 (2002) 376
Comparison of metabolic labeling and label-free quantitation Label free assumption: constant for all samples Metabolic Metabolic labeling assumption: constant for all samples and the behavior of heavy and light isotopes is identical G. Zhang et al., JPR 8 (2008) 1285-1292
Intensity variation between runs Replicates 1 IP 1 Fractionation 1 Digestion vs 3 IP 3 Fractionations 1 Digestion G. Zhang et al., JPR 8 (2008) 1285-1292
How significant is a measured change in amount? It depends on the size of the random variation of the amount measurement that can be obtained by repeat measurement of identical samples. Metabolic
Protein Complexes – specific/non-specific binding Tackett et al. JPR 2005
Protein Turnover Heavy Light Move heavy labeled cells to light medium Newly produced proteins will have light label KC=log(2)/tC, tCis the average time it takes for cells to go through the cell cycle, and KT=log(2)/tT, tT is the time it takes for half the proteins to turn over.
Super-SILAC Geiger et al., Nature Methods 2010
Quantitation – Protein Labeling Assumption: All losses after mixing are identical for the heavy and light isotopes and Lysis Light Heavy Fractionation Digestion LC-MS MS H L Gygi et al. Nature Biotech 17 (1999) 994
Quantitation – Labeled Proteins Recombinant Proteins (Heavy) Lysis Assumption: All losses after mixing are identical for the heavy and light isotopes and Light Fractionation Digestion LC-MS MS H L
Quantitation – Labeled Chimeric Proteins Recombinant Chimeric Proteins (Heavy) Lysis Fractionation Light Digestion LC-MS MS H L Beynon et al. Nature Methods 2 (2005) 587 Anderson & Hunter MCP 5 (2006) 573
Quantitation – Peptide Labeling Assumption: All losses after mixing are identical for the heavy and light isotopes and Lysis Fractionation Digestion Light Heavy LC-MS MS H L Gygi et al. Nature Biotech 17 (1999) 994 Mirgorodskaya et al. RCMS 14 (2000) 1226
Quantitation – Labeled Synthetic Peptides Assumption: All losses after mixing are identical for the heavy and light isotopes and Lysis Fractionation Synthetic Peptides (Heavy) Digestion Light Enrichment with Peptide antibody LC-MS Anderson, N.L., et al. Proteomics 3 (2004) 235-44 MS H L Gerber et al. PNAS 100 (2003) 6940
Quantitation – Label-Free (MS/MS) Lysis Fractionation Digestion LC-MS SRM/MRM MS/MS MS MS MS/MS
Quantitation – Labeled Synthetic Peptides Light Lysis/Fractionation Synthetic Peptides (Heavy) Synthetic Peptides (Heavy) Digestion LC-MS MS MS H L MS/MS L H MS/MS MS/MS L MS/MS H H L
Quantitation – Isobaric Peptide Labeling Lysis Fractionation Digestion Light Heavy LC-MS MS MS/MS H L Ross et al. MCP 3 (2004) 1154
Isotope distributions Intensity m/z m/z m/z
Peak Finding Intensity Find maxima of m/z The signal in a peak can be estimated with the RMSD and the signal-to-noise ratio of a peak can be estimated by dividing the signal with the RMSD of the background
Background subtraction Intensity m/z
Estimating peptide quantity Peak height Peak height Curve fitting Curve fitting Intensity Peak area m/z
Time dimension Intensity m/z Time Time m/z
Sampling Intensity Retention Time
Sampling 5% 5% Acquisition time = 0.05s
Estimating peptide quantity by spectrum counting Time m/z Liu et al., Anal. Chem. 2004, 76, 4193
What is the best way to estimate quantity? Peak height - resistant to interference - poor statistics Peak area - better statistics - more sensitive to interference Curve fitting - better statistics - needs to know the peak shape - slow Spectrum counting - resistant to interference - easy to implement - poor statistics for low-abundance proteins
Isotope distributions Intensity ratio Intensity ratio Peptide mass Peptide mass
AADDTWEPFASGK Intensity Intensity Intensity Time
AADDTWEPFASGK Intensity Intensity Intensity 2 Ratio 1 0 2 Ratio 1 0 Time
AADDTWEPFASGK Intensity Intensity Intensity G m/z H m/z I m/z
YVLTQPPSVSVAPGQTAR Intensity Intensity Intensity Time
YVLTQPPSVSVAPGQTAR Intensity Intensity Intensity 2 Ratio 1 0 2 Ratio 1 0 Time
YVLTQPPSVSVAPGQTAR Intensity Intensity Intensity m/z m/z m/z
Mass Calibration Cox & Mann, Nat. Biotech. 2008
The accuracy of quantitation is dependent on the signal strength Cox & Mann, Nat. Biotech. 2008
Workflow for quantitationwith LC-MS Standardization Retention time alignment Mass calibration Intensity normalization Quality Control Detection of problems with samples and analysis Quantitation Peak detection Background subtraction Limits for integration in time and mass Exclusion of interfering peaks
Biomarker discovery Lysis Fractionation Digestion LC-MS MS MS
Reproducibility Paulovich et al., MCP 2010
Biomarker verification Light Lysis/Fractionation Synthetic Peptides (Heavy) Synthetic Peptides (Heavy) Digestion LC-MS MS MS H L MS/MS L H MS/MS MS/MS L MS/MS H H L
Reproducibility CPTAC Verification Work Group Study 7 10 peptides 3 transitions per peptide Conc. 1-500 fmol/μl Human plasma Background 8 laboratories 4 repeat analyses per lab Addona et al., Nat. Biotech. 2009
Reproducibility Addona et al., Nat. Biotech. 2009