laura.davies@monash
10 likes | 135 Vues
On the Relationships of Large to Small Scales in a Convecting Atmosphere in the Real World and a CRM. L. Davies, C. Jakob, V. Kumar, P. May and A. Protat. School of Mathematical Sciences, Monash University, Australia. laura.davies@monash.edu.

laura.davies@monash
E N D
Presentation Transcript
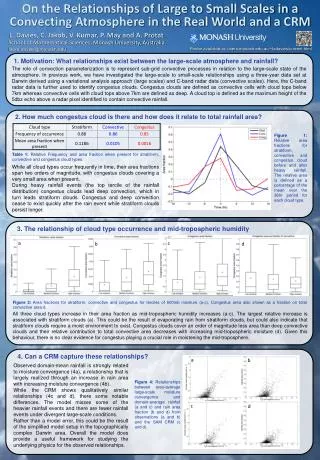
On the Relationships of Large to Small Scales in aConvecting Atmosphere in the Real World and a CRM L. Davies, C. Jakob, V. Kumar, P. May and A. Protat School of Mathematical Sciences, Monash University, Australia. laura.davies@monash.edu Poster available at: users.monash.edu.au/~ladavies/current.html 1. Motivation: What relationships exist between the large-scale atmosphere and rainfall? The role of convection parameterization is to represent sub-grid convective processes in relation to the large-scale state of the atmosphere. In previous work, we have investigated the large-scale to small-scale relationships using a three-year data set at Darwin derived using a variational analysis approach (large scales) and C-band radar data (convective scales). Here, the C-band radar data is further used to identify congestus clouds. Congestus clouds are defined as convective cells with cloud tops below 7km whereas convective cells with cloud tops above 7km are defined as deep. A cloud top is defined as the maximum height of the 5dbz echo above a radar pixel identified to contain convective rainfall. 2. How much congestus cloud is there and how does it relate to total rainfall area? Figure 1: Relativearea fractions for stratiform, convective and congestus cloud before and after heavy rainfall. The relative area is defined as a percentage of the mean over the 36hr period for each cloud type. Table 1: Relative Frequency and area fraction when present for stratiform, convective and congestus cloud types. While all cloud types occur frequently in time, their area fractions span two orders of magnitude, with congestus clouds covering a very small area when present. During heavy rainfall events (the top tercile of the rainfall distribution) congestus clouds lead deep convection, which in turn leads stratiform clouds. Congestus and deep convection cease to exist quickly after the rain event while stratiform clouds persist longer. 3. The relationship of cloud type occurrence and mid-tropospheric humidity a c b d Figure 3: Area fractions for stratiform, convective and congestus for terciles of 600mb moisture (a-c). Congestus area also shown as a fraction on total convective area d. All three cloud types increase in their area fraction as mid-tropospheric humidity increases (a-c). The largest relative increase is associated with stratiform clouds (a). This could be the result of evaporating rain from stratiform clouds, but could also indicate that stratiform clouds require a moist environment to exist. Congestus clouds cover an order of magnitude less area than deep convective clouds and their relative contribution to total convective area decreases with increasing mid-tropospheric moisture (d). Given this behaviour, there is no clear evidence for congestus playing a crucial role in moistening the mid-troposphere. 4. Can a CRM capture these relationships? a b Observed domain-mean rainfall is strongly related to moisture convergence (4a), a relationship that is largely realized through an increase in rain area with increasing moisture convergence (4b). While the CRM shows qualitatively similar relationships (4c and d), there some notable differences. The model misses some of the heavier rainfall events and there are fewer rainfall events under divergent large-scale conditions. Rather than a model error, this could be the result of the simplified model setup in the topographically complex Darwin area. Overall the model does provide a useful framework for studying the underlying physics for the observed relationships. Figure 4: Relationships between area-average large-scale moisture convergence and domain-average rainfall (a and c) and rain area fraction (b and d) from observations (a and b) and the SAM CRM (c and d). d c