Download
1 / 5
50 likes | 68 Vues
Explore the web interface demonstration of the Laser Interferometer Gravitational-Wave Observatory (LIGO) GDS DMT Monitor. Get access to time series, histograms, and various display formats for analysis. Presented at the LSC 2002 Spring Meeting.

E N D
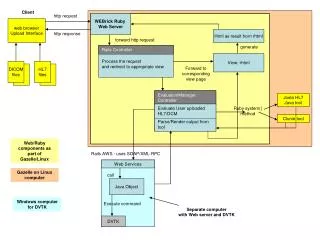
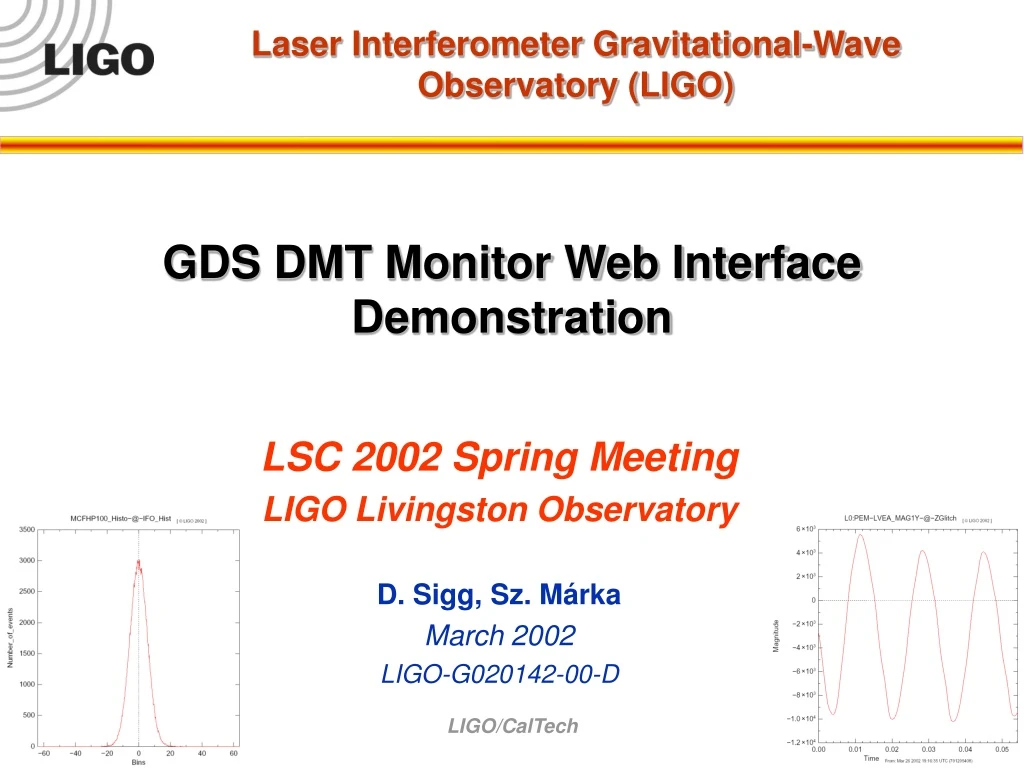
Laser Interferometer Gravitational-Wave Observatory (LIGO) GDS DMT Monitor Web InterfaceDemonstration LSC 2002 Spring Meeting LIGO Livingston Observatory D. Sigg, Sz. Márka March 2002 LIGO-G020142-00-D LIGO/CalTech
From the entrance to the monitor list LIGO/CalTech
Example: List of TimeSeries and Histograms LIGO/CalTech
Histograms and some display formats Postscript Acrobat PNG or GIF image LIGO/CalTech
TimeSeries and provided formats XML for DTT TEXT and binary for plotting and analysis utilities Large selection of graphics format for instant graphing LIGO/CalTech