Download
1 / 13
130 likes | 257 Vues
Transmission Initiatives in New England Meeting Reliability and Clean Energy Objectives Global Warming Solutions and Clean Technology Conference Barclays Capital May 20, 2010. Safe Harbor Provisions.

E N D
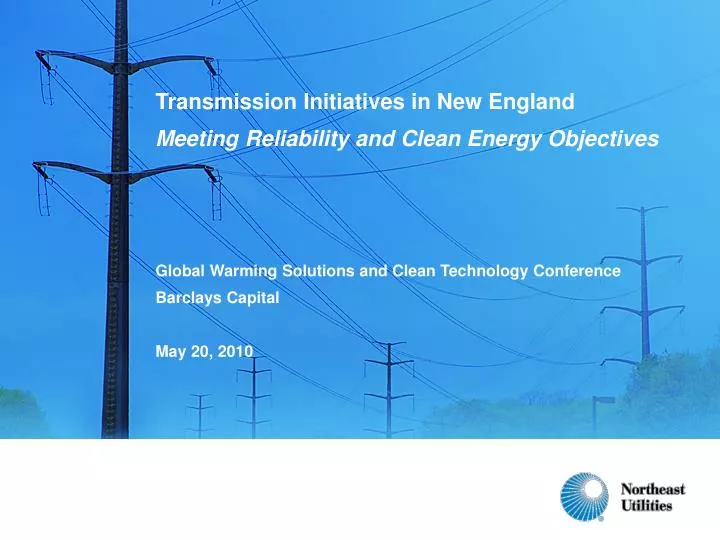
Transmission Initiatives in New England Meeting Reliability and Clean Energy Objectives Global Warming Solutions and Clean Technology Conference Barclays Capital May 20, 2010
Safe Harbor Provisions This presentation contains statements concerning NU’s expectations, beliefs, plans, objectives, goals, strategies, assumptions of future events, future financial performance or growth and other statements that are not historical facts. These statements are “forward-looking statements” within the meaning of the Private Securities Litigation Reform Act of 1995. In some cases, a listener or reader can identify these forward-looking statements through the use of words or phrases such as “estimate”, “expect”, “anticipate”, “intend”, “plan”, “project”, “believe”, “forecast”, “should”, “could”, and other similar expressions. Forward-looking statements are based on the current expectations, estimates, assumptions or projections of management and are not guarantees of future performance. These expectations, estimates, assumptions or projections may vary materially from actual results. Accordingly, any such statements are qualified in their entirety by reference to, and are accompanied by, the following important factors that could cause our actual results to differ materially from those contained in our forward-looking statements, including, but not limited to,actions or inaction of local, state and federal regulatory and taxing bodies; changes in business and economic conditions, including their impact on interest rates, bad debt expense and demand for our products and services; changes in weather patterns; changes in laws, regulations or regulatory policy; changes in levels and timing of capital expenditures; disruptions in the capital markets or other events that make our access to necessary capital more difficult or costly; developments in legal or public policy doctrines; technological developments; changes in accounting standards and financial reporting regulations; fluctuations in the value of our remaining competitive electricity positions; actions of rating agencies; and other presently unknown or unforeseen factors. Other risk factors are detailed from time to time in our reports to the Securities and Exchange Commission (SEC). Any forward-looking statement speaks only as of the date on which such statement is made, and we undertake no obligation to update the information contained in any forward-looking statements to reflect developments or circumstances occurring after the statement is made or to reflect the occurrence of unanticipated events. This presentation references actual and projected EPS by business, a non-GAAP presentation, which management believes is useful to investors to evaluate the actual and projected financial performance and contribution of our businesses. This non-GAAP financial measure should not be considered as alternatives to our consolidated net income attributable to controlling interests, and EPS determined in accordance with GAAP as an indicator of operating performance. Please refer to our reports to the SEC for further details concerning the matters described in this presentation.
Northeast Utilities Overview Regulated companies Service territories Total customers: 2.1 million Total infrastructure assets: $8.8 billion • Regulated T&D company • 1.21 million retail customers in 149 cities and towns in Connecticut The Connecticut Light and Power Company VT NH • Regulated integrated electric utility • 496,000 retail customers in 211 cities and towns in New Hampshire • ~1,200MW of regulated generation assets Public Service Company ofNew Hampshire Electric territory The Connecticut Light andPower Company Public Service Companyof New Hampshire Western MassachusettsElectric Company • Regulated T&D company • 205,000 retail customers in 59 cities and towns in western Massachusetts Western Massachusetts Electric Company MA Gas territory Yankee GasServices Company • Regulated natural gas delivery company with significant growth potential • Largest natural gas distribution system in Connecticut as measured by number of customers (~205,000), and size of service territory (2,088 square miles) RI CT Yankee Gas Services Company Electric Gas
New England Continues to be a First Mover in Resolving Transmission Reliability and Promoting Clean Energy Solutions • The ability to plan and deploy significant Transmission infrastructure has been proven • Each year (since 2000) ISO-NE provides a robust 10-year Regional System Plan • Over $4B of reliability work has been successfully completed through this process • Another $6B of transmission projects are part of the current Regional System Plan • Connecticut customers alone have already benefited by more than $500M since 2007 • The commitment to clean energy is demonstrable at both state and regional levels • New England is a leader in the U.S. in promoting energy conservation and demand-side management • Each state has RPS targets and participates in the Regional Greenhouse Gas Initiative • Connecticut and Massachusetts are taking a pragmatic approach to smart grid deployment • The region’s clean energy objectives and resources are significant • The region is long on renewables through 2013; a shortfall widens by 2020 • Substantial renewable potential exists in Northern New England, Canada and off-shore • This potential is large-scale but, in almost all instances, distant from regional load centers • Regional transmission solutions can integrate distant renewable resources with innovative power technologies to achieve clean energy objectives
Renewable Collector Lines Hydro-Quebec- HVDC “Inshore Wind” Renewables & Clean Energy Projects in Development/ High Wind potential areas 4 “Offshore“ Wind HVDC Line between Quebec and New Hampshire 3 Connecticut Borders (MA, RI): NEEWS Projects Under Way 2 Southwest CT Reliability Projects: Complete 1 “Cape Wind” Transmission as a Key Enabler to Solving New England’s Clean Energy Challenges
The Southwest Connecticut Projects Demonstrated Our Ability to Site, Permit, Construct and Operate Transmission Projects in Numerous Challenging Environments Four southwest CT transmission projects completed at a cost of $1.6 billion; nearly $80 million under budget and one year ahead of schedule Congestion cost savings to Connecticut customers, since 2007, in excess of $500M
New England East-West Solutions (NEEWS) Projects Advance Regional Reliability • NEEWS Overview • Jointly developed with NGRID • Enhances several important regional reliability needs • $1.49 billion: NU share • Greater Springfield Reliability Status • Approved by CT; MA decision expected in 2010 • Construction start in late 2010; in-service 2013 • Rhode Island Reliability Status (NGRID) • RI decision expected mid-2010; in-service 2013 • Interstate Reliability Status • Jointly owned with NGRID • Need assessment expected by mid-2010 • Central CT Reliability Status • Need assessment expected by mid-2010
´ Northern Pass HVDC Line To Connect Hydro-Québec Generation To New England Market • Background • Joint venture between NU (75%) and NSTAR (25%) for U.S. portion • 1200 MW transfer capability on a new HVDC line • Capital cost estimate for US segment: $900 million ($675 million for NU share) • Current Status • Following favorable FERC decision in May 2009, NU and NSTAR have been working to advance key agreements • JDA with HQ-TransEnergie • TSA with HQ-US for filing with FERC • PPA for review by states • Significant “project” work under way • Routing and early engineering • Determination of southern terminus and associated AC upgrades • Discussions with federal agencies regarding Presidential Permit and Special Use Permit from USFS • New Hampshire community outreach • Technical studies leading to I.39 application to ISO-NE Des Cantons HVDC Line HVDC Converter Station
Developing a Regional Renewable Solution for New England Renewable Energy Projections Estimated Class I Renewable Energy Requirements for New England in 2020 is 22,800 GWh’s 6,600 GWh = Existing Available Renewables 3,500 GWh = Currently Planned or Under Development 12,700 GWh = Unplanned Renewables/Balance Shortfall Class I Technologies include: > Biomass/Biofuels > Fuel Cells (CT) > Landfill Gas > Small Hydro > Solar PV > On and Offshore Wind Renewable Capacity Needed to Fill 2020 Shortfall Wind (on-shore & off-shore) Other Class I Technologies ~ 3,300 MW ~ 500 MW This implies a significant amount of new projects, each requiring connection and integration with New England’s power delivery infrastructure
Transmission Now Represents More Than 50% of Regulated Earnings 2005 12 Months Ended March 31, 2010 25.2% 53.3% $41.1 $169.0 $147.9 $122.3 74.8% 46.7% Net Income: $163.4 Regulated EPS: $1.24 Net Income: $316.9 Regulated EPS: $1.79 Regulated Net Income (In millions) Distribution/Generation Transmission
More Than 40 Individual Firms Have Supported NU Transmission Initiatives Since 2006 • Our pursuit of New England’s clean energy objectives is a platform for continued investment, collaboration and technology innovation
What is Congestion? • Energy requirements in a region are met by a combination of the most economic generating resources being dispatched and energy imports into the region over transmission lines. • When the energy requirements in a region exceed the maximum level of energy imports over transmission lines, less economic generation in that region is dispatched. • Congestion is a measure of the expense of the uneconomic generation being dispatched compared against what could have been imported if more transmission import capability was available. • By increasing transmission import capability, congestion expense can be reduced along with the emissions associated with the uneconomic generation being dispatched.