Download
1 / 1
10 likes | 135 Vues
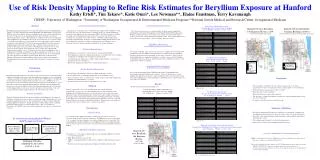
* (1). (1) *. * (1). *(4). (1) *. *(8). * (4). *(7). *(1). *(1). *(9). *(1). (2)*. (6)*. * (1). * (3). * (1). *(1). *(6). *(6). * (28). *(14). *(24). * (18). *(10). Retired Building Trades Workers 30/427 = 7.0%. Current Workers 20/420 = 4.8%. Retired Production,

E N D
* (1) (1) * *(1) *(4) (1)* *(8) *(4) *(7) *(1) *(1) *(9) *(1) (2)* (6)* *(1) *(3) *(1) *(1) *(6) *(6) *(28) *(14) *(24) *(18) *(10) Retired Building Trades Workers 30/427 = 7.0% Current Workers 20/420 = 4.8% Retired Production, R&D Workers 17/354 = 4.8% 3720 333 All Hanford Workers with BeLPTs (Nov 2000) 67/1201 = 5.6% 305 313 306 314 304 303 3707 3708 3731 384 3717 3706 340 3745 327 3730 3745 321 328 326 3702 329 324 338 325 308 336 3760 3709 337 309 318 320 Person-Years 331 0-25 25.1-50 50.1-100 100.1-200 > 200 Sensitized jobs/bldg (of 6 sensitized workers) *(#) 333 305 313 Hanford 300 Area Beryllium: Job Exposure History, n=7,769 Job Exposure Matrix 306 314 304 303 3708 3718 3706 327 3745 328 326 329 324 325 308 309 318 320 Person-Years 331 0-100 101-500 501-1250 1251-1500 >1500 Sensitized jobs/bldg (of 11 sensitized workers) *(#) Use of Risk Density Mapping to Refine Risk Estimates for Beryllium Exposure at Hanford Kathy Ertell*, Tim Takaro*, Katie Omri*, Lee Newman**, Elaine Faustman, Terry Kavanaugh CRESP - University of Washington; *University of Washington Occupational & Environmental Medicine Program;**National Jewish Medical and Research Center, Occupational Medicine Abstract Long Term Stewardship of Beryllium Buildings Former Hanford Worker Questionnaires Former Hanford Worker Questionnaires Beryllium Exposed Jobs, Person-Years by BuildingTop 15 Buildings Number of workers = 294 Hanford 300 Area Beryllium: Job Exposure History, n=294 Former Worker Beryllium Questionnaire Hanford 300 Area Beryllium: Common Buildings (5/2001) Job Exposure Matrix and Former Worker Beryllium Questionnaire Beryllium was used in nuclear fuel rod research and manufacturing at the US Department of Energy’s (US DOE) Hanford site in eastern Washington from approximately 1950 to 1988. With the increased recognition of chronic beryllium disease as an occupational health issue, there has been great interest in identifying buildings where beryllium was used and characterizing risk for workers. Although there are workplace exposure records indicating where beryllium was used at Hanford, the records are not believed to be a complete picture of beryllium work at Hanford. Using job histories, an exposure matrix, results of medical screening tests (beryllium LPT) for both current and retired Hanford workers, and recent building characterization data, risk density maps of Hanford work locations have been produced. These maps show person-years of beryllium exposure and job titles by work location for both sensitized and nonsensitized exposed workers. By combining and comparing these multiple sources of information for the risk density mapping, the list of building where beryllium was used has been refined; information about the types of work performed by sensitized workers has been gathered; and the work locations for beryllium-exposed workers have been defined in greater depth. The results of the risk density mapping will help prioritize future building characterization, guide work planning for decontamination and decommissioning; and refine risk estimates for current and former workers. The higher rate of sensitization in construction workers suggests that remediation workers and others who access the inner structures of buildings (walls, etc.) during maintenance, construction, decontamination, decommissioning (D&D), and demolition may be at higher risk. Improved risk characterization and disease detection along with effective risk communication is a critical need for these workers. US DOE is addressing these needs through new beryllium rules, interagency research funding, building characterizations, and risk communication materials. Evolving site implementation and validation of new laboratory technology and risk communication methods are the next challenges. The other major data source was occupational history questionnaires completed by participants in University of Washington’s Former Hanford Worker Medical Monitoring Program: production workers, union workers (non-construction trades), maintenance workers, professionals, and research and development workers. These questionnaires asked about exposures to various agents, job titles, buildings, and years worked. 3720 JEM / Employer Work Histories Beryllium Risk Jobs Person-Years by Building 333 305 313 306 Risk Density Mapping Rationale 314 304 303 3707 3708 3731 384 3717 3706 340 3745 327 3718 3730 3745 321 Job categories, building, and production year were used to estimate risk. Jobs with probable beryllium exposure were linked to historical employer work history files and beryllium prevalence study questionnaires, matching on years and job categories. Years for all jobs with beryllium risk were summed by building for total person-years worked by building, with separate analysis for all exposed and sensitized workers. 40,892 job records for 7,769 workers were available for analysis. 328 326 3702 • Beryllium was recognized as a renewed exposure concern in the mid 1990s. • Site buildings have undergone sampling (wipe and air) to determine the level of beryllium contamination in buildings where beryllium was used in the past. • As buildings undergo maintenance or D&D, additional characterization of inner spaces and inaccessible areas is being done. • Risk density mapping can help prioritize ongoing characterizations. 329 324 338 325 308 336 3760 3709 337 Jobs Held by Sensitized WorkersData from Employer Work HistoriesTop 15 Jobs by Job Title N=30* 309 318 320 331 Former Hanford Worker Questionnaires Be Risk Job Person-Years by Building Job Exposure Matrix Former Worker Questionnaire only Both Introduction Beryllium Risk Density Mapping Goals Beryllium at Hanford Beryllium sensitization and disease have been a topic of great concern to the US Department of Energy (US DOE) in recent years, with the identification of numerous cases of beryllium sensitization and chronic beryllium disease throughout the US DOE complex. Beryllium has been an important metal in nuclear weapons production for years. At Hanford, its most important use was in a zirconium alloy braze ring used in fuel rods for the N-Reactor. It was also used in various research and development projects. Hanford’s fuels development and fabrication occurred in the 300 Area. Fuels-related manufacturing ended in 1988, but many of the buildings still exist and now are used for other purposes. The question of exposure from past activities remains a high priority for both current and former workers. Person-years were summed for each building using worker’s occupational history questionnaire indicating beryllium risk in each job. Years were divided across several buildings if workers listed several jobs. All years listed for each job were used (10% listed more than 3 buildings per job, with a maximum of 10 buildings per job). Questionnaires for 294 workers were available. • Identify higher risk buildings in 300 Area for D&D, maintenance workers. • Provide framework for combining beryllium data sets from different sources. • Utilize sensitized workers as sentinel events to suggest risk associated with building, and ultimately task within building or operation. • Provide a readily accessible format for describing risk to workers. Limitations Results Methods • The total number of beryllium-exposed workers is unknown due to the lack of comprehensive worker rosters, transient workers, and incomplete process information. • Recall and memory among former workers is variable. • Tracking former workers is difficult. • The potential bias in nonresponders is unknown. • The importance of particle size/chemistry is unknown, and data regarding details of past exposures is imprecise. • No unexposed populations were evaluated for maps. Results are presented in tabular and map form. Job Exposure Matrix - Employer Work HistoriesBeryllium Exposed Jobs, Person-Years by BuildingTop 15 Buildings Number of workers=7,769 Using two major data sources, a job exposure matrix and occupational history questionnaires, person-years of potential beryllium exposure were summed for each building in the beryllium operations period. Person-years are color coded on the maps. Superimposed are asterisks indicating where sentinel cases with beryllium sensitization or disease have worked. The number represents jobs in a building performed by a sensitized worker. Each job is counted once, but a sensitized worker may have several jobs in the 300 Area and may have worked in several different buildings. Separate maps were produced for each data source, and a combined map of overlaps was produced. Beryllium - Health Effects Jobs Held by Sensitized WorkersData from Former Hanford Worker QuestionnairesTop 15 Job Types by Job Title N=12* The most significant health effects come from inhalation of beryllium dust. In sensitized individuals, an immunologic reaction begins, usually in the lungs, which progresses to form granulomas and pulmonary fibrosis. The scarring interferes with gas exchange and makes breathing difficult. It can lead to death from respiratory failure. Skin reactions, including granuloma formation and slow wound healing, can also occur. The Lymphocyte Proliferation Test (BeLPT) can detect sensitized individuals before they show clinical signs of disease. Data Sources Summary of Findings Job Exposure Matrix A job exposure matrix (JEM) was created to estimate exposure risk for various job categories during the last five decades at Hanford. The JEM used job category and decade of job to estimate exposure. Exposures were rated as unlikely, possible, or probable. The original JEM did not include building. A revised JEM included known beryllium buildings and job categories expected to be at risk of exposure based on type of beryllium operation in building. • Risk density mapping holds promise as a technique for reconstructing, organizing, and visualizing exposure patterns and locations in complex, large-scale work environments. • The utility of risk density mapping is highly dependent on the availability and quality of underlying data sources. • The technique may be helpful for worker risk communication. • Future versions will incorporate building characterization data. Be Sensitization Among Hanford Workers, BeLPT (single test) Positive 300 Area Buildings Where Sensitized Workers WorkedCombined Data, JEM-Employer Work Histories and Former Worker QuestionnairesTop 15 Buildings Number of workers = 30* JEM / Employer Work History File Linkage Consortium for Risk Evaluation with Stakeholder Participation For the purposes of developing occupational histories for individuals, JEM data was linked to several existing datasets: • REX - Hanford radiation exposure files • OHH88 - occupational health/work history files compiled by Hanford medical contractor, 1988 • Work history questionnaires gathered under Hanford beryllium prevalence study. CRESP - Consortium of University of Washington, University of Medicine and Dentistry of New Jersey - Rutgers, and Vanderbilt University This work was prepared with the support of the U.S. Department of Energy under Award No. DE-FG26-00NT40938. However, any opinions, findings and conclusions or recommendations expressed herein are those of the authors and do not necessarily reflect the views of the US DOE.