Download
1 / 34
340 likes | 510 Vues
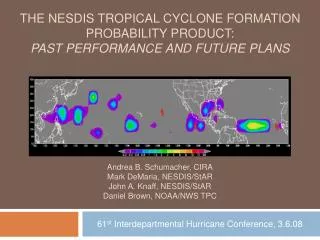
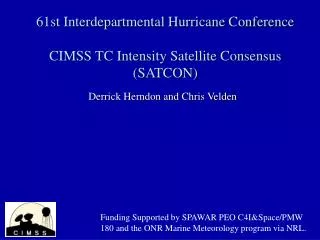
62nd Interdepartmental Hurricane Conference CIMSS TC Intensity Satellite Consensus (SATCON). Derrick Herndon and Chris Velden. ADT. SATCON. CIRA AMSU. CIMSS AMSU. Funding Supported by SPAWAR PEO C4I&Space/PMW 180 and the ONR Marine Meteorology program via NRL. . Motivation.

E N D
62nd Interdepartmental Hurricane ConferenceCIMSS TC Intensity Satellite Consensus (SATCON) Derrick Herndon and Chris Velden ADT SATCON CIRA AMSU CIMSS AMSU Funding Supported by SPAWAR PEO C4I&Space/PMW 180 and the ONR Marine Meteorology program via NRL.
Motivation • Importance of getting current TC intensity right • Intensification trends • CI and short term change in statistical forecast models • Climatology (Basin Best Tracks) • Estimates of TC intensity can vary by more than 40 knots • Hurricane Lili 2002 current intensity estimates 5 hours prior • to landfall varied from 83 - 125 kts • Hurricane Isabel 2003 intensity estimates varied from 77 - • 105 kts 17 hours prior to landfall. • Hurricane Charley 2004 rapid intensification • Several objective TC intensity methods exist • Goal is to assist forecasters in assessing current intensity by combining the best aspects of individual objective estimates into a single estimate
Clear Eye Pinhole Eye Large Eye Uniform Curved Band Shear Members: ADT
Members: ADT Strengths Time-averaging results in consistency Temporal frequency - every 1/2 hour Method based on the reliable Dvorak Technique Global coverage with few gaps (eclipses) Familiarity Weaknesses Sensitive to scene type identification IR signature not strongly related to intensity Time-averaging can miss rapid intensity changes IR image from NRL TC Page
Members: CIMSS AMSU Channel 8 150 mb Channel 7 250 mb 55 Knots 550 mb Channel 6 AMSU Tb Anomaly vertical cross section for Katrina 2005 70 Knots TC Pressure Anomaly Magnitude 125 knots AMSU Channel 8 Anomaly Magnitude
Members: CIMSS AMSU Strengths Tb Anomaly magnitude directly related to intensity No dependence on previous estimate TC-relative MSW training allows for motion component Weaknesses Resolution requires sub-sampling corrections Dependence on ancillary data (RMW, P_env) Polar orbiter pass coverage IR image from NRL TC Page
Members: CIRA AMSU Strengths Temperature anomaly directly related to TC intensity CLW useful in accounting for attenuation Provides objective estimate of critical wind radii Higher latitudes (Best Track training) Weaknesses CLW may not correct for all of the attenuation Reliance on model data for boundary conditions No sub-sampling correction for resolution IR image from NRL TC Page
CIMSS SATCON • Combine estimates into a single SATellite CONsensus (SATCON) estimate • Assign weights using known statistical performance in a given situation for each method. Actual weights are RMSE error for the method. • ADT performs best in clear eye scenes • CIMSS AMSU performs best for weaker storms and when eye is large for stronger storms • CIRA AMSU performs best when eye is large and position of AMSU-A matches TC position
Next Step: Information Sharing • What relationships might exist between the parameters of the member algorithms? • Can these parameters be shared across the algorithms to improve the individual members? • After all corrections are made re-define the weights and produce a weighted consensus of the corrected members
Information Sharing: ADT to AMSU Get Estimate of Eye Size IR can be used to estimate eye size CIMSS AMSU uses eye size information to correct resolution sub-sampling Use RMW to adjust MSW? Compare to AMSU-A FOV resolution Adjust AMSU pressure if needed
Information Sharing: CIRA to ADT • Use CIRA T-max to correct ADT non- eye scene estimates • Emerging eyes • Post-ERC • Excessive weakening after eye fills NRL-MRY ADT MSLP Error (mb) NRL-MRY CIRA AMSU Tmax (K)
AMSU-B 89 Ghz AMSU-A FOV TC Center Information Sharing: CIMSS to CIRA CIRA MSLP Error (mb) AMSU-B 89 Ghz (K) Position bias used to correct CIMSS AMSU can be used for CIRA as well. A strong relationship exists between AMSU-B 89 Ghz signal (convolved) within the AMSU-A FOV and CIRA estimate error for both MSLP (shown) and MSW
Information Sharing ADT currently does not use any estimate of environmental pressure. ATCF messages used by CIMSS includes P_env • Storm Motion Component • Both ADT and CIRA AMSU developed using Best Track MSW data. • The component of the MSW imparted by storm motion is intrinsic to • this data set. • Storm motions which deviate from the Best Track data average • (about 11 knots) are not accounted for by these members. • Apply 50% of anomalous motion component to the ADT and CIRA. Especially important for recurving storms moving > 30 knots
Examples ADT determines scene is an eye scene CIMSS AMSU near Nadir. Eye is large compared to AMSU resolution CIRA is sub-sampled NRL-MRY ADT = 28 % CIMSS AMSU =47 % CIRA AMSU = 25 %
Examples ADT determines scene is a CDO scene CIMSS AMSU position near limb. Eye is small CIRA AMSU position located near true TC center NRL-MRY ADT = 22 % CIMSS AMSU =34 % CIRA AMSU = 44 %
Examples ADT determines scene is a SHEAR scene CIMSS AMSU indicates no sub-sampling present CIRA AMSU: no sub-sampling due to position offset NRL-MRY ADT = 18 % CIMSS AMSU =41 % CIRA AMSU = 41 %
Examples: Katrina 2005 ADT CDO Eye emerges in IR
1999-2006 Stats (Pressure) Dependent sample. Values in millibars. Validation is aircraft recon (buoys) pressure +/- 3 hours from estimate time - bias = method was too weak.
1999-2006 Stats (MSW) Dependent sample. Values in knots. Validation is best track msw coincident with aircraft recon +/- 3 hours from estimate time. A - bias = method was too weak.
1999-2006 Stats Compare to Simple Dependent sample. MSW validation in knots. MSLP validation in millibars. - bias = method was too weak. SIMPLE is simple average of the 3 members
1999-2006 Compare to Dvorak MSW validation in knots vs. Best Track. MSLP validation in millibars vs. recon. Neg. bias = method was too weak. Dvorak is average of TAFB and SAB estimates
2007 Stats (MSW) Independent sample. Values in knots. Validation is best track msw coincident with aircraft recon +/- 3 hours from estimate time. - bias = method was too weak.
2007 Stats (MSLP) Independent sample. Values in millibars. Validation is recon MSLP +/- 3 hours from estimate time. - bias = method was too weak.
2007 Compare to Dvorak Independent validation. MSW validation in knots. MSLP validation in millibars. - bias = method was too weak. Dvorak is average of SAB and TAFB
Future Work • Address MW latency • Add error bars for estimate confidence • Continue cross-platform information sharing • Add additional TC intensity methods (SSMI / TRMM ?) • Interactive Web Interface
SATCON HOMEPAGE http://cimss.ssec.wisc.edu/tropic2/real-time/satcon
References Brueske K. and C. Velden 2003: Satellite-Based Tropical Cyclone Intensity Estimation Using the NOAA-KLM Series Advanced Microwave Sounding Unit (AMSU). Monthly Weather Review Volume 131, Issue 4 (April 2003) pp. 687–697 Demuth J. and M. Demaria, 2004: Evaluation of Advanced Microwave Sounding Unit Tropical-Cyclone Intensity and Size Estimation Algorithms. Journal of Applied Meteorology Volume 43, Issue 2 (February 2004) pp. 282–296 Herndon D. nd C. Velden, 2004: Upgrades to the UW-CIMSS AMSU-based TC intensity algorithm. Preprints, 26th Conference on Hurricanes and Tropical Meteorology, Miami, FL, Amer. Meteor. Soc., 118-119. Kossin J. 2007: Estimating Hurricane Wind Structure in the Absence of Aircraft Reconnaissance Weather and Forecasting Volume 22, Issue 1 (February 2007) pp. 89–101 Olander T. 2007: The Advanced Dvorak Technique: Continued Development of an Objective Scheme to Estimate Tropical Cyclone Intensity Using Geostationary Infrared Satellite Imagery. Wea. and Forecasting Volume 22, Issue 2 (April 2007) pp. 287–298 Velden C. 2006: The Dvorak Tropical Cyclone Intensity Estimation Technique: A Satellite-Based Method that Has Endured for over 30 Years. Bulletin of the American Meteorological Society Volume 87, Issue 9 (September 2006) pp. 1195–1210
Members: ADT Uses IR imagery to assess eye temperature, curvature and cloud region temperature. Linear regression scheme developed by matching recon MSLP estimates to important IR parameters. Logic based on the subjective Dvorak Method developed in the 1970’s. Each TC image is classified according to “scene type” which drives the logic structure leading to the intensity estimate IR image from NRL TC Page
Members: CIMSS AMSU Microwave sounder which includes channels for measuring brightness temperatures (Tb) in the 550-150 mb layer. AMSU-A (temperature) and AMSU-B (moisture) 1998-present Resolution ~ 50 km at nadir to 100 km at the limb Multiple regression scheme using Tb anomaly magnitude from the 3 AMSU-A channels and 1 AMSU-B channel Corrections applied to account for sub-sampling, hydrometeor scattering and scan geometry. Trained versus recon MSLP and TC-relative MSW IR image from NRL TC Page
AMSU Sub-sampling Corrections Correcting for position Correcting for resolution Get Estimate of Eye Size AMSU-B 89 Ghz AMSU-A FOV TC Center Compare to AMSU-A FOV resolution Portion of TC eyewall is within the AMSU-A FOV indicating the AMSU-A pixel location is offset from true TC center. Find AMSU-B center-weighted (convolved) Tb. Used as regression Term. Adjust AMSU pressure if needed
Members: CIRA AMSU AMSU-A Tb are used to produce a statistical temperature retrieval at 23 pressure levels along with CLW which is used to correct for attenuation due to hydrometers Data is smoothed to a 12 X 12 degree 22 km grid. Geopotential height field is derived using Hydrostatic Equation then integrated downward using boundary conditions from NCEP model to get surface pressure field. MSW is estimated from pressure gradient wind. TC intensity is determined using derived pressure field, tangential winds at 5 km height, AMSU FOV resolution and RMW at height of 3 km IR image from NRL TC Page
Members: CIRA AMSU CIRA AMSU TC intensity predictors MSW Tangential wind at height of 5 km Maximum temperature anomaly Average CLW within 100 km radius Percent of CLW > 0.5 mm within 300 km RMW at height of 3 km AMSU-A FOV resolution MSLP Pressure anomaly estimated from 600 km radius to center IR image from NRL TC Page