Download
1 / 33
330 likes | 492 Vues
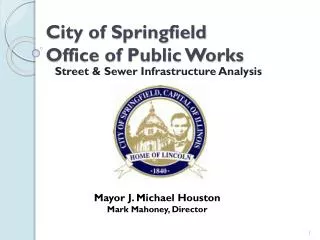
City of Springfield Office of Public Works. Street & Sewer Infrastructure Analysis . Mayor J. Michael Houston Mark Mahoney, Director . Street Needs. Estimate $44 Million Needed Annually Road Maintenance i.e. Bituminous Overlay, Concrete Patching, Oil & Chip, and Sidewalk Repair

E N D
City of SpringfieldOffice of Public Works Street & Sewer Infrastructure Analysis Mayor J. Michael Houston Mark Mahoney, Director
Street Needs • Estimate $44 Million Needed Annually • Road Maintenance i.e. Bituminous Overlay, Concrete Patching, Oil & Chip, and Sidewalk Repair • Road Modernization i.e. Curb, Storm Sewer, and Sidewalk Installation • Road Expansion i.e. Constructing a New Street or Widening an Existing Street to Support Increased Traffic
Asphalt Road Ratings Better Worse
Contributing Factors to Deteriorating Infrastructure • Construction costs have more than doubled in last 10 years • In 1997 the City owned 497 miles, now the City owns 625 miles • Federal Funding for maintenance has vanished. In 2007 a FAU Overlay in the amount of $1.7 million was completed, funding for overlays has been non-existent since. • MFT Funding has been decreasing since 2007 due in part to more fuel efficient cars • Preventative Maintenance has been neglected
FY14 Infrastructure Funding • Federal funds/grants (i.e. ITEP & STU) and TIF funds could be utilized to help fund infrastructure improvements. The Department will be applying for these funds. Gambling revenue is a potential source of funding.
MFT Funds • Contractual Services (i.e. Concrete Patching, Seal Coat and Crack Fill) • Maintenance Materials (i.e. Salt, Asphalt, Rock, and Sign Materials) • Engineering & Construction (i.e. Major Road, Bridge, Signal and IDOT Projects)
Fund 95 Improvements Overlays • FY 11 – 2.6 miles = $1.25 million ($481 k/mile) • FY 12 – 4.0 miles = $2.57 million ($642 k/mile) • FY 13 – 15 miles = $6.02 million ($400 k/mile) • FY 14 – 15 miles = $6 million (proposed) Sidewalk • FY 11 – 8,000 s.f. (0.4 miles) = $51 k • FY 12 – 102,000 s.f. (4.8 miles) = $738 k • FY 13 – 156,000 s.f. (7.4 miles) = $1.03 million • FY 14 – 155,000 s.f. = $1 million (proposed)
Implemented Maintenance Measures • Overlay Program – 15 miles • Concrete Patching – Increased by 30% • Seal Coat – Increased by 30% • Crackfill – Doubled program • Sidewalk Program – Increased by 30%
How to stop the decline • Complete 135 miles of overlay the next 3 years and perform 24 miles of overlay per year thereafter • Substantially increase preventative pavement maintenance (i.e. Cape Seals, Microsurfacing, CIR, Chip Seals and Crackfilling) • Nearly triple the amount of sidewalk installation • Remain at the recently increased concrete patching levels and start sealing and undersealing joints • Repair failing brick streets • Start performing preventative storm sewer maintenance • Five times more maintenance required for traffic signals and striping
Necessary 3 Year Plan • Asphalt Overlay (135 miles) $57.6 million • Cape/Microsurfacing (50 miles) $4.5 million • Concrete Patching (15 miles) $3 million • Crackfilling (100 miles) $1 million • Oil & Chip (150 miles) $3 million • Sidewalk (1.2 million s.f.) $9 million • Brick Streets (2 miles) $3 million • Traffic Signals and Striping $1 million • Storm Sewer $4.5 million TOTAL $86.6 million
Annual Maintenance Plan Program (proposed amount) CurrentProposed • Overlay (24 miles per year) $4.5 million $12 million • Sidewalk (400,000 s.f. per year) $1 million $3 million • Cape/Micro(30 miles per year) - $2.5 million • Concrete Patch (5 miles per year) $1 million $1 million • Concrete Seal (20 miles per year) - $200,000 • Seal Coat (50 miles per year) $600,000 $1 million • Crack Fill (60 miles per year) $150,000 $600,000 • Brick (.5 miles per year ) - $200,000 • Storm Sewer $150,000 $1.5 million • Traffic Signals & Striping $100,000$500,000 TOTAL $7.5 million $22.5million Increase = $15 million
Current Funding Level Projection 220 Miles = $110 Million • Current Funding – Project only able to overlay 10 miles and 30 miles additional • roads needing to be overlaid after 2013
Potential Long Term Savings The proposed increase will save the City approximately $21 million through 2018 It’s anticipated, at the current spending rate, that 220 miles (over 60%) of our asphalt would have deteriorated and need to be overlaid or reconstructed by 2018 Additional savings will occur beyond 2018 due to utilizing preventative maintenance and extending the life of our roads
Overview • The City of Springfield established the Sewer Fund in 1956 to maintain the Combined Sewers and Separate Sanitary Sewers. • The City owns approximately : • 140 miles of Combined Sewers • 355 miles of Separate Sanitary Sewers • 200 miles of Separate Storm Sewers • Separate Storm Sewers dedicated only for storm runoff are not maintained by this Fund. • This Fund was established to pay for improvements recommended in the first study of the sewer system completed in 1949. • The study recommended $8.2 million in improvements = $97 million today
Financial Summary • Notes • Operation and Maintenance costs increase yearly. • Repair costs continually increasing due to increases in the number of repairs and construction cost increase. • Increased Expenses reduce money available for improvement projects. • Sewer Surplus maintains funds for required loan reserves, capitol projects, and long term expenditures.
Sewer Rates • Current City Sewer Rates were established in 1996. • The City does not set the Sanitary District Rates. • Customers pay a base meter charge and a rate based on consumption. • Rate paid for a typical residential customer using 10 units of water. Average Customer Basis (meter charge + 10 units of water consumption) City Rate $3.10 + (($0.35 x 3) + ($0.75 x 7)) = $9.40 District Rate $3.57 + ($1.49 x 10) = $18.47 Total $9.40 + 18.47 = $27.87 * SMSD has scheduled rate increases thru 2016
Sewer Rate Comparison • Rates based on 10 units = 1,000 c.f. = 7500 gallons of water usage. • Rates do not include Sanitary District Fees.
Projects - FY13 • Mayden Street Sewer Replacement completed summer 2012 • Cost approximately $200,000 • Bancroft Branch Relocation completed summer 2012 • City’s cost approximately $285,000 • Dirksen Parkway Sewer Lining - Ridge Street to Elm Street • To be completed February 2013 • Cost approximately $140,000 Total $625,000
Planned FY14 Project Areas • Westchester Trunk Sewer Upsizing • Anticipated June 2013 completion • Trenchless pipe bursting construction • Estimated cost $615,000 • Northeast and Grandview Sewer District - Flow monitoring • Estimated cost $100,000 • Cook Street Sewer District - Physical Inspection • Pasfield Sewer Abandonment - Project Design
Increasing Regulatory Concerns • Collection System operation is regulated by the EPA. • The EPA is successful in rendering Administrative Orders and Consent Decrees against operators not maintaining their systems or complying with Federal Regulations. • The City is in the Administrative Order process with the USEPA at this time. We expect the order to be finalized soon. • The City will be required to complete an analysis of and fund projects to eliminate all Sanitary Sewer Overflows (SSO). • The USEPA will review and approve a timeline for completion. • This will have a significant impact on the Sewer Fund.
Metropolitan St. Louis Sewer District (MSD) In August 2011, the Department of Justice filed a settlement, or consent decree, requiring MSD to spend a minimum $4.7 billion over the next 23 years to address the issue of overflows and other sewer system improvements.
City Project History • Amount available for projects will reach $0 in only a few years. • Decreased maintenance spending now results in increased future replacement costs.
10 Year Capital Improvement Plan • $55 million in projects already identified • Sewer Division currently funds less than $1 million per year in projects. • Several areas (Cook Street Sewer District, Harvard Park Area, Northeast Sewer District) will require studies to determine needs, this work will modify and add projects to the Long Range CIP. • 10 Year Completion Goal not possible at current funding levels. • USEPA Mandates are not accounted for in the current Long Range Plan. FY13 Project Spending - $625,000 Minimum $5.5 million per year needed to complete CIP in 10 year time frame.
Conclusion The City of Springfield’s infrastructure is in decline. Long term increased costs of neglect will mean spending more by necessity or by regulatory order at some point in the future. Proposal to stop the decline: • 3 Year- $86.6 million on streets, sidewalks, storm sewers, and traffic signals. • Annual Maintenance Plan (effective FY2016)- $22.5 million on streets, sidewalks, storm sewers, and traffic signals • 10 Year Sanitary Sewer Capital Improvement Plan-$55 million ($5.5 million annually)