Download
1 / 71
710 likes | 985 Vues
Long Swings in Homicide. 1. 1. 1. Outline. Evidence of Long Swings in Homicide Evidence of Long Swings in Other Disciplines Long Swing Cycle Concepts: Kondratieff Waves More about ecological cycles Models. 2. 2. 2. Part I. Evidence of Long Swings in Homicide.

E N D
Long Swings in Homicide 1 1 1
Outline • Evidence of Long Swings in Homicide • Evidence of Long Swings in Other Disciplines • Long Swing Cycle Concepts: Kondratieff Waves • More about ecological cycles • Models 2 2 2
Part I. Evidence of Long Swings in Homicide • US Bureau of Justice Statistics • Report to the Nation On Crime and Justice, second edition • California Department of Justice, Homicide in California 3 3 3
Bureau of Justice Statistics, BJS “Homicide Trends in the United States, 1980-2008”, 11-16-2011 “Homicide Trends in the United States”, 7-1-2007 4 4 4
Bureau of Justice Statistics Peak to Peak: 50 years 5 5 5
8 8
1980 9 9 9
Executions in the US 1930-2007 http://www.ojp.usdoj.gov/bjs Peak to Peak: About 65 years 10 10 10
11 11
Part Two: Evidence of Long Swings In Other Disciplines • Engineering • 50 year cycles in transportation technology • 50 year cycles in energy technology • Economic Demography • Simon Kuznets, “Long Swings in the Growth of Population and Related Economic Variables” • Richard Easterlin, Population, labor Force, and Long Swings in Economic Growth • Ecology • Hudson Bay Company 12 12
Cesare Marchetti 13 13 13
Erie Canal 14 14
10% 90% 1890 1921 1859 15 15 15
Cesare Marchetti: Energy Technology: Coal, Oil, Gas, Nuclear 52 years 57 years 56 years 16 16 16
17 17
18 18
Richard Easterlin 20 year swings 19 19
Cycles in Nature Canadian Lynx and Snowshoe Hare, data from the Hudson Bay Company, nearly a century of annual data, 1845-1935 The Lotka-Volterra Model (Sarah Jenson and Stacy Randolph, Berkeley ppt., Slides 4-9) 20 20
21 21
What Causes These Cycles in Nature? • At least two kinds of cycles • Harmonics or sin and cosine waves • Deterministic but chaotic cycles 22 22
Part Three: Thinking About Long Waves In Economics • Kondratieff Wave 23 23 23
Nikolai Kondratieff (1892-1938) Brought to attention in Joseph Schumpeter’s Business Cycles (1939) 24 24 24
2008-2014: Hard Winter 25 25 25
26 26 26
Cesare Marchetti“Fifty-Year Pulsation In Human Affairs”Futures 17(3):376-388 (1986)www.cesaremarchetti.org/archive/scan/MARCHETTI-069.pdf • Example: the construction of railroad miles is logistically distributed 27 27 27
Cesare Marchetti 28 28 28
Theodore Modis Figure 4. The data points represent the percentage deviation of energy consumption in the US from the natural growth-trend indicated by a fitted S-curve. The gray band is an 8% interval around a sine wave with period 56 years. The black dots and black triangles show what happened after the graph was first put together in 1988.[7] Presently we are entering a “spring” season. WWI occurred in late “summer” whereas WWII in late “winter”. 29 29 29
Well Documented Cycles 31 31
The Predator-Prey Relationship • Predator-prey relationships have always occupied a special place in ecology • Ideal topic for systems dynamics • Examine interaction between deer and predators on Kaibab Plateau • Learn about possible behavior of predator and prey populations if predators had not been removed in the early 1900s 34
Schematic of the Criminal Justice System: Simultaneity Causes ? Weak Link Offense Rate Per Capita Crime Generation Expected Cost of Punishment OF = f(CR, SV, CY, SE, MC) (detention, Deterrence, Rehabilitation, And revenge) Expenditures Crime Control 36 CR = g(OF, L)
Get Expect 37 Source: Report to the Nation on Crime and Justice
Part Five: The Lotka-Volterra Model • Built on economic concepts • Exponential population growth • Exponential decay • Adds in the interaction effect • We can estimate the model parameters using regression • We can use simulation to study cyclical behavior 39
Lotka-Volterra Model Vito Volterra (1860-1940) famous Italian mathematician Retired from pure mathematics in 1920 Son-in-law: D’Ancona Alfred J. Lotka (1880-1949) American mathematical biologist primary example: plant population/herbivorous animal dependent on that plant for food 40
Predator-Prey 1926: Vito Volterra, model of prey fish and predator fish in the Adriatic during WWI 1925: Alfred Lotka, model of chemical Rx. Where chemical concentrations oscillate 41 41 41 41
Applications of Predator-Prey 42 42 42 42 Resource-consumer Plant-herbivore Parasite-host Tumor cells or virus-immune system Susceptible-infectious interactions
Non-Linear Differential Equations 43 43 43 43 dx/dt = x(α – βy), where x is the # of some prey (Hare) dy/dt = -y(γ – δx), where y is the # of some predator (Lynx) α, β, γ, and δ are parameters describing the interaction of the two species d/dt ln x = (dx/dt)/x =(α – βy), without predator, y, exponential growth at rate α d/dt ln y = (dy/dt)/y = - (γ – δx), without prey, x, exponential decay like an isotope at rate
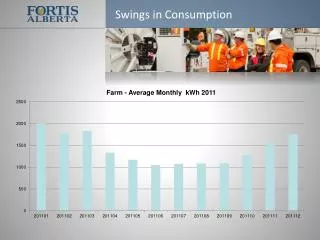
CA Population: exponential rate of growth, 1995-2007 is 1.4% 46
Prey (Hare Equation) • Hare(t) = Hare(t=0) ea*t , where a is the exponential growth rate • Ln Hare(t) = ln Hare(t=0) + a*t, where a is slope of ln Hare(t) vs. t • ∆ ln hare(t) = a, where a is the fractional rate of growth of hares • So ∆ ln hare(t) = ∆ hare(t)/hare(t-1)=[hare(t) – hare(t-1)]/hare(t-1) • Add in interaction effect of predators; ∆ ln Hare(t) = a – b*Lynx • So the lynx eating the hares keep the hares from growing so fast • To estimate parameters a and b, regress ∆ hare(t)/hare(t-1) against Lynx 47
Hudson Bay Co. Data: Snowshoe Hare & Canadian Lynx, 1845-1935 48
[Hare(1865)-Hare(1863)]/Hare(1864)Vs. Lynx (1864) etc. 1863-1934 • ∆ hare(t)/hare(t-1) = 0.77 – 0.025 Lynx • a = 0.77, b = 0.025 (a = 0.63, b = 0.022) 49
[Lynx(1847)-Lynx(1845)]/Hare(1846)Vs. Lynx (1846) etc. 1846-1906 ∆ Lynx(t)/Lynx(t-1) = -0.24 + 0.005 Hare c = 0.24, d= 0.005 ( c = 0.27,d = 0.006) 50