Download
1 / 30
300 likes | 565 Vues
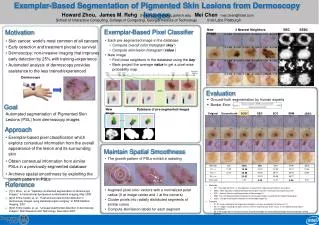
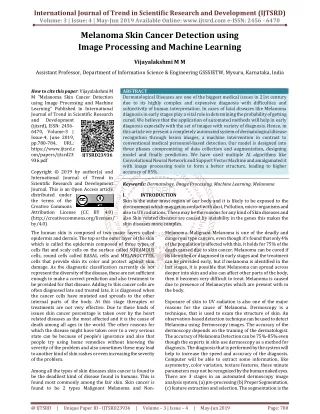
Machine Classification of Melanoma and Nevi from Skin Lesions. John David Osborne and Song Gao. Outline. Melanoma Problem Description Biology Clinical Features Previous Research Methods Sample Images in Experiments Steps in Proposed Algorithm Experimental Results Discussion

E N D
Machine Classification of Melanoma and Nevi from Skin Lesions John David Osborne and Song Gao
Outline • Melanoma • Problem Description • Biology • Clinical Features • Previous Research • Methods • Sample Images in Experiments • Steps in Proposed Algorithm • Experimental Results • Discussion • Limitations of Current Work • Future Directions
Melanoma and Nevi • Melanoma is a form of skin cancer • Not the most common, but the most malignant • 75% of all skin cancer fatalities • Melanocytes (cells that produce the pigment melanin) become cancerous • Environmental (sunlight exposure) and genetic influences • Nevi or Naevi • Singular term is “Nevus” • Benign tumor of melanocytes • Often confused with melanoma
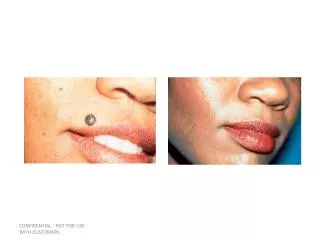
Melanoma versus Nevus Melanoma Nevi
Previous Classification Research • Extensive research done with detect differences from clinically captured digital images of suspicious moles • K-nearest-neighbor classifier was shown to have a mean sensitivity of 95% and 98%, mean specificity of 78% and of 79% on melanoma and nevi respectively. • Kernel Logistics PLS classifier was shown to have performance similar to dermatologists with a sensitivity of 95% and a specificity of 60% • Another separate recent publication has claimed accuracy over 95% • Problem Remains • Specificity isn’t that good • Consequences are serious • Gold standard is histological slide
Histology: Melanoma versus Nevi Melanoma Nevus
Histological Criteria • lesion asymmetry • poor circumscription of the lesion with single cells extending beyond the dermal component • irregular and confluent nests variable in size and shape • pagetoid spread (suprabasal melanocytes) • confluent growth and the dermal epidermal junction (DEJ) • absence of maturation (failure of melanocyte nuclei to become smaller with further descent into the nucleus) • involvement of the hair follicle • cytological and nuclei atypia • nuclear enlargement • melanocytic nuclei enlarged relative to keratinocytic ones • variability in size and shape of nucleus • hyperchromatism and prominent nucleoli) • mitoses in the dermis and the presence of dermal necrotic melanocytes [1, 2].
Previous WorkHistology Image Processing • Minimal • Much more complicated • Neuroblastoma • Intracellular protein localization • Determination of malignancy based on staining pattern • Automated identification of abnormal metaphase chromosome cells for the detection of chronic myeloid leukemia using microscopic images • To the best of our knowledge, no other group is distinguishing between melanoma and nevus on the basis of histology slides
Sample Images in Experiments 40x 100x 200x 400x
Steps in Proposed Algorithm • Remove irrelevant areas • Coarse filtering • Fine filtering – more accurate! • Recovering • Distinguish relevant areas • SVM training for the prediction • Extract features • SVM model training
Coarse Filtering • All images are converted into HSV color space, which is more perceptual uniform compared with RGB color space. • Thresholdh=0.7, (252°) • Thresholds=0.05
Fine Filtering • Red area occupies most remaining pixels of the image after coarse filtering. • A precise threshold is required to further remove the red area. • A histogram with 256 bins is built based on the h-value of the remaining pixels. • The interval of dominant bin represents the h-range of red tissue. • Pixels with h-value above this interval are all related with red tissue. • Polynomial curve fitting – p(x) • Better describe the distribution of the histogram • The higher the degree is, the better the curve fits. • argmax(p(x)) is more accurate as a threshold than the interval value of the highest bin. • Pixels with h-value larger than argmax(p(x)) is removed from the image.
Recovering (1/2) • The nuclear stain bleeds over into the surrounding giving them a similar hue and saturation to the red tissue. • The surrounding pixels with the form of small segments are also removed by the filtering procedure. • Small segments are related with cytoplasm, which is relevant area. • Need recover the small segments Mask after filtering White: irrelevant area
Recovering (2/2) • What’s the area threshold? • A histogram is built based on the descending area of segments. • Bin width – area interval (e.g. 10 pixels) • Bin height – # of segments within corresponding area interval • The area threshold is determined by the area interval of the 1st bin which has a lower number of segments than an user input parameter. (e.g. 10 segments)
Demo of Image Segmentation Coarse filtering Fine filtering Recovering Otsu’s method Distinguish between blue area and white area Relevant areas
Extracting Features • Criteria • The size of a nucleus becomes larger within melanocytes. • The shape of nucleus of a melanocyte tends to become more asymmetric. • Four features • The ratio of the number of nuclei to the area of cytoplasm • The ratio of the area of nuclei to the area of cytoplasm • The ratio of the perimeter of a nucleus to its area • The ratio of the major length of a nucleus to its minor length
The SVM Training for the Prediction • A multi-class support vector classification (SVC) is provided by LIBSVM* • Two kernel functions are used in the SVC, such as rbf (Radial basis function) function and linear function. • 15 feature combinations with 4 different magnification of training dataset are trained on SVC. *http://www.csie.ntu.edu.tw/~cjlin/libsvm/
Experiments (1/2) Statistical information of image dataset • Evaluation criteria • Accuracy: # of correctly predicated records • Melanoma – positive; nevus – negative
Experiments (2/2) SVC comparative results
Limitations of Current Features • Area Features • The number of nuclei to the area of cytoplasm. Each segment in the blue area is a nucleus, and the area of the white area is the area of cytoplasm. • The area of nuclei to the area of cytoplasm • Atypical Nucleus Features • The perimeter of a nucleus to the area of it. • The major length of a nucleus to the minor length of it • Our feature selection has 2 major problems • Melanocyte Problem • Lymphocyte Problem
The Melanocyte Problem -Relies on someone else to fill the image with melanocytes -Not really automated -Won’t work on all areas of the slide -Nuclear atypia in non-melanocytes has nothing to do with melanonoma
The Lymphocyte Problem Inflammatory infiltrate is full of lymphocytes with staining nucleus Lymphocytes are very small, and a dense distribution of nuclei Indicates inflammation, present in various disease and infections including melanoma Looking for nuclear superploidy, may be counting lymphocytes
Limitations of Current Work • Using only a tiny fraction of available known features • Over a dozen features available • Lack of feedback for performance metrics for cell type identification and ground truth • Are we looking at the right cells? • Have melanocyte masks, could use them • Lack of regional information • Is this melanocyte in the right place • Reliance on human to set slide • Inability to classify the various types of melanoma or nevi
Future Directions • Current work • Used simple (banal) melanoma and some cases of melanoma in situ • Simple banal nevus and one dysplastic nevus • Slides were manually processed to select areas of interest • Obvious extensions • Handle more types of Melanoma and Nevi • Additional diagnostic features • Get and use the entire slide • Ability to recognize cell types • Ability to recognize regions and layers • Maturation of Nests
Additional Features A - Asymmetry in an intradermalnaevus (25x) B – Lymphocyte Infiltration (100x) C - Confluent nests in a junctional nevus (200x) D - Poor circumscription: the junctional melanocytic proliferation ends with single cells (200x) E - Predominance of single melanocytes and suprabasal melanocytes (200x) F - Involvement of the hair follicle G - Cytological atypia in a compound naevus (300x)
Lowest Hanging Fruit • Additional Feature - Lesion Asymmetry • Highly diagnostic • Need entire slide • Cell type recognition • Melanocyte • Lymphocyte (small, darkly staining) • Can use additional feature of lymphocyte invasion • Keratinocytes • Epithelial cells
Region detection Allows detection of nesting, maturation and pagetoid spread Nevus Melanoma
Highest Hanging Fruit Multiple types of nevus and melanoma Need knowledge base of diagnostic criteria Could make the algorithm more general purpose (allow detection of melanoma mimics)