Download
1 / 50
500 likes | 676 Vues
“The U.S. Drought of 2012-13 Lingers and Shifts Westward”. Brad Rippey, USDA Meteorologist, Washington, D.C. Agricultural Outlook Forum Crystal Gateway Marriott Hotel Arlington, Virginia, February 21, 2014. Potential U.S. Trouble Spots, 2014 Growing Season.

E N D
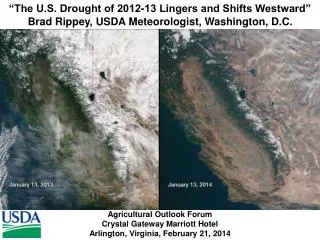
“The U.S. Drought of 2012-13 Lingers and Shifts Westward” Brad Rippey, USDA Meteorologist, Washington, D.C. Agricultural Outlook Forum Crystal Gateway Marriott Hotel Arlington, Virginia, February 21, 2014
Potential U.S. Trouble Spots,2014 Growing Season • California (third year of drought; depleted soil moisture; diminishing water supplies) • Great Basin, Southwest (see California) • Southern Great Plains (fourth year of drought?; drought-damaged rangeland; subsoil moisture shortages) • Corn Belt (lingering drought in Upper Midwest; wetness issues some places?) • Western Gulf Coast (trending dry)
Sep. 10, 2013: summer peak, with 50.69% of CONUS in drought.
Feb. 18, 2014: 35.73% of CONUS in drought.
Percentiles and the U.S. Drought Monitor • Advantages of percentiles: • Can be applied to any parameter • Can be used for any length of data record • Puts drought in historical perspective • D4, Exceptional Drought: once per 50 to 100 years • D3, Extreme Drought: once per 20 to 50 years • D2, Severe Drought: once per 10 to 20 years • D1, Moderate Drought: once per 5 to 10 years • D0, Abnormally Dry: once per 3 to 5 years
California Agricultural Production Statistics, 2012 • The state’s 80,500 farms and ranches received a record $44.7 billion for their output in 2012, up from $43.3 billion in 2011 and $37.9 billion in 2010. • California is the number one state in cash farm receipts with 11.3 percent of the U.S. total. • The state accounted for 15 percent of domestic receipts for crops and 7.1 percent of the U.S. revenue for livestock and livestock products. Source: California Department of Food and Agriculture
California Agricultural Production Statistics, 2012 • Milk: $6.90 billion • Grapes: $4.45 billion • Almonds: $4.35 billion • Nursery plants: $3.54 billion • Cattle, Calves: $3.30 billion • Strawberries: $1.94 billion • Lettuce: $1.45 billion • Walnuts: $1.35 billion • Hay: $1.25 billion • Tomatoes: $1.17 billion Note: These ten commodities accounted for approximately two-thirds of California’s agricultural cash receipts in 2012. Source: California Department of Food and Agriculture
Percent of Normal Precipitation October 1, 2013 – February 19, 2014
SNOTEL – River Basin Snow Water Content Feb. 19, 2014
1975-76 1917-18 1990-91 2013-14
California Reservoir Storage, Million Acre-Feet, 2010-14 2011 2010 California recovered from a previous drought in 2009-10. The current drought began during the winter of 2011-12 and has persisted through 2012-13 and into 2013-14. Avg. 2012 2013 2014 Source: California Department of Water Resources Note: One acre-foot is equal to 325,851 gallons, or the amount of water it takes to cover one acre to a depth of one foot. California’s reservoir storage is down nearly 20 million acre-feet, or about 6.35 trillion gallons, since the summer of 2011.
California Reservoir Storage, Percent of Normal, 2010-14 2011 2010 2012 2013 California recovered from a previous drought in 2009-10. The current drought began during the winter of 2011-12 and has persisted through 2012-13 and into 2013-14. 2014 Source: California Department of Water Resources
California Reservoirs, Recharge and WithdrawalMillion Acre-Feet and Percent of Average RechargeWithdrawal 2010-11 12.5 (151%) 2011 8.8 (107%) 2011-12 5.8 (70%) 2012 11.5 (140%) 2012-13 6.5 (79%) 2013 11.2 (136%) 2013-14 TBD 2014 TBD Avg. 8.2 Avg. 8.2
Daily Sierra Nevada Snowpack (Inches) vs. Normal Normal 2012-13 2011-12 2013-14 Source: California Department of Water Resources
X = Rankings of Driest Years 2011-13 7 9 8 1986-94 5 12,11 1975-77 6 10 2 4,3 1
Agricultural Weather Assessments World Agricultural Outlook Board
Agricultural Weather Assessments World Agricultural Outlook Board
Western Reservoir SituationFebruary 1, 2014 • Besides California, reservoir storage for this time of year is far below normal in Nevada, New Mexico, and Oregon.
Potential U.S. Trouble Spots,2014 Growing Season • California (third year of drought; depleted soil moisture; diminishing water supplies) • Great Basin, Southwest (see California) • Southern High Plains (fourth year of drought?; drought-damaged rangeland; subsoil moisture shortages) • Corn Belt (lingering drought in Upper Midwest; wetness issues farther east?) • Western Gulf Coast (trending dry)
Agricultural Weather Assessments World Agricultural Outlook Board
Percent U.S. Winter Wheat Abandonment1909-2013 Years since the 1950s with W.W. abandonment > 22%: 1983, 1989, 1991, 1996, 2001, 2002, 2006, and 2013 Years since the 1950s with W.W. abandonment > 22%: 1983, 1989, 1991, 1996, 2001, 2002, 2006, and 2013 1917 1917 1933 1933 1935 1935 1951 1951 2002 2002 1989 1989 ’13 1928 1928 1955 1955 1983 1983 1996 ’06 ’06 1996 ’13* 2013: 2nd highest winter wheat abandonment in the “modern era” behind 2002
2004 2013 2012 Index Weighting: Excellent = 4; Good = 3; Fair = 2; Poor = 1; Very Poor = 0
Winter Wheat ConditionsFebruary 2, 2014 StateVPPFGEX Texas (2/2) 14 27 40 17 2 Oklahoma 4 20 40 31 5 Kansas 3 17 45 33 2 Nebraska 3 15 36 40 6 S. Dakota 3 13 24 53 7 Montana 1 5 48 43 3 Illinois 1 3 40 53 3 Texas (2/16) 13 31 39 15 2
Percent Texas Cotton Abandonment1980-2013 2011 2013 1998 2006 1992 1986 Source: USDA
Potential U.S. Trouble Spots,2014 Growing Season • California (third year of drought; depleted soil moisture; diminishing water supplies) • Great Basin, Southwest (see California) • Southern High Plains (fourth year of drought?; drought-damaged rangeland; subsoil moisture shortages) • Corn Belt (lingering drought in Upper Midwest; wetness issues farther east?) • Western Gulf Coast (trending dry)
U.S. Corn Yield, Bushels Per Acre1985-2013 The impacts of the 2012 drought and heat on corn were severe; lowest U.S. yield since 1995. 2009 2013 2004 1994 2010-12: First time U.S. corn yield fell 3 years in a row since 1928-30. 2012 1995 1993 From “USDA Agricultural Projections to 2023”: 2014 U.S. corn yield of 165.6 bushels/acre 1988
Iowa, Summer Average Temperature (°F), 1895-2013 1988 2010 2011 2012 1995 2002 2013 2009 2004 1992
Agricultural Weather Assessments World Agricultural Outlook Board
Agricultural Weather Assessments World Agricultural Outlook Board
Current Soil Moisture (Modeled) Climate Prediction Center University of Washington Even though some flooding is occurring now in the Lower Midwest, soil moisture models point toward the northern Plains as the region to watch for potential spring flooding and planting delays.
“Fast Track” Secretarial Disaster Designation Process • Streamlines the USDA Secretarial designation process by eliminating steps from the current process; • A reduced interest rate for emergency loans that effectively lowers the current rate from 3.75 percent to 2.25 percent; • Preserves the ability of a state governor or Indian Tribal Council to request a Secretarial Disaster Designation; • Removes the requirement that a request for a disaster designation be initiated only by a state governor or Indian Tribal Council; • Further streamlines the disaster designation process for severe drought occurrences by utilizing the U.S. Drought Monitor as a tool to automatically trigger disaster areas with no further documentation; • Does not impose any new requirements on producers or the public. • Led to drought disaster declarations in 2,254 counties in 39 states.
U.S. Drought Monitor Usage by FSA • Food, Conservation, and Energy Act of 2008 (“Farm Bill”) authorizes the Livestock Forage Disaster Program (LFP) • Grazing loss because of drought on owned or leased grazing land or pastureland that is physically located in a county experiencing: • D2 intensity for at least 8 consecutive weeks during normal grazing period will be eligible to receive an amount equal to 1 monthly payment • D3 intensity during the normal grazing period will be eligible to receive an amount equal to 2 monthly payments • D3 intensity for at least 4 weeks or a D4 intensity any time during the grazing period will be eligible to receive an amount equal to 3 monthly payments
U.S. Drought Monitor Usage by FSA • Agricultural Act of 2014 (“Farm Bill”) re-authorizes the Livestock Forage Disaster Program (LFP) • Grazing loss because of drought on owned or leased grazing land or pastureland that is physically located in a county experiencing: • D2 intensity for at least 8 consecutive weeks during normal grazing period will be eligible to receive an amount equal to 1 monthly payment • D3 intensity during the normal grazing period will be eligible to receive an amount equal to 3 monthly payments • D3 intensity for at least 4 weeks or a D4 intensity any time during the grazing period will be eligible to receive an amount equal to 4 monthly payments • D4 intensity for at least 4 weeks during the normal grazing period will be eligible to receive an amount equal to 5 monthly payments
2008 “Farm Bill” Livestock Forage Disaster Program (LFP) Payouts (financial assistance to producers who suffered grazing losses due to drought or fire on or after January 1, 2008, and before October 1, 2011, during the calendar year in which the loss occurs): • 2008 calendar year: $165,540,837 • 2009 calendar year: $ 98,739,950 • 2010 calendar year: $ 33,334,458 • 2011 calendar year: $180,950,088 • 2012 calendar year: $ 0 • LFP total, 2008-11: $478,565,333
Retroactive LFP Payouts The 2014 Farm Bill contains permanent livestock disaster programs including the Livestock Forage Disaster Program, which will help producers in California and other areas recover from the drought. At President Obama’s direction, USDA is making implementation of the disaster programs a top priority and plans to have the programs available for sign up in 60 days. Producers will be able to sign up for the livestock disaster programs for losses not only for 2014 but for losses they experienced in 2012 and 2013. While these livestock programs took over a year to get assistance out the door under the last Farm Bill, USDA has committed to cut that time by more than 80 percent and begin sign-up in April. California alone could potentially receive up to $100 million for 2014 losses and up to $50 million for previous years.
Thank you! • Contact info - e-mail: brippey@oce.usda.gov - phone: (202) 720-2397 Signing of the 2014 Farm Bill Michigan State University February 7, 2014
U.S. Billion-Dollar Disasters, 1980-2013 1.Hurricane Katrina 2005 $148.8 • Drought 1988 $ 78.8 • Superstorm Sandy 2012 $ 65.7 • Drought 1980 $ 56.4 5. Hurricane Andrew 1992 $ 44.8 6. Flooding 1993 $ 33.8 7. Drought 2012 $ 30.3 8. Hurricane Ike 2008 $ 29.2 • Hurricane Wilma 2005 $ 19.0 • Hurricane Rita 2005 $ 19.0 Source: National Climatic Data Center (http://www.ncdc.noaa.gov/billions/)