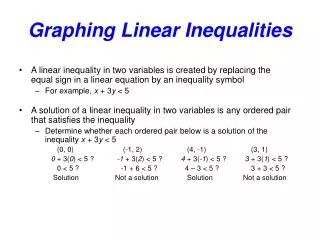
Graphing Linear Inequalities
This guide explains the concept of linear inequalities and how to graph them effectively. A linear inequality is a relation with a straight line boundary, dividing the coordinate plane into half-planes. The line can either be solid or dashed, depending on whether the inequality includes equality (≥ or ≤) or not (≥ or ≤). We demonstrate shading regions through point testing and provide examples to help visualize different inequalities. With clear explanations and helpful tips, this guide ensures you grasp the essentials of graphing linear inequalities.

Graphing Linear Inequalities
E N D
Presentation Transcript
Graphing Linear Inequalities Created by TyannaCasiano and Cody Kwasniewski
What is a linear inequality? • A linear inequality is not a function. • It is a relation whose boundary is a straight line. On the left is an image of a very simple inequality; y≥x. The line crosses through (0,0) and the line is a straight line.
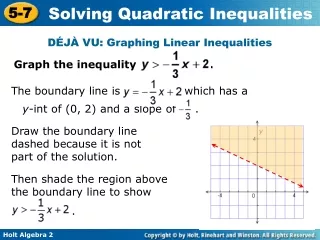
Lets look at the graph of y≥x • The graph of y≥x separates the coordinate plane into two regions, which is called half planes. • The line is also known as the boundary of each region. It separates each region. • This is a solid line, which is because of the ≥ or < symbol. If it was just a > or < symbol, a dashed line would be used.
One more thing about this graph! • In the picture you can see that one half of the graph is shaded, that is due to testing a point. • How do you know which side to shade? • Take a point, (0,2) for example. Test it in the equation y≥xwhich when done is 2≥0. • Because the statement is true, you would shade on that side of the line. If it were false, you would shade the opposite side of the line.
More Graphing! • Graph the equation y>|x-2| • The absolute value should be split in half when graphed and the lines should be dotted because of the > in the equation. • Test the point (0,0) to see if it works. • Since 0>2 is false, shade inside the V looking graph. (inside the dotted lines)
Try for yourself • y > 3x + 2 • y < |x+3| • y + 1 > -5x -3 • y – 2x + 1 ≤ 4
Answers 2. y ≤ |x+3| • y > 3x + 2 3. y + 1 > -5x -3 also as y>-5x-4 4. y – 2x + 1 ≤ 4 also as y≤2x+3
Don’t forget to ask questions! • A few that we had when we learned this section was…. • “How do you know what to shade?” • Always plug in a point. If it doesn’t work and balance out, shade the other side of the line that the point wasn’t in! • “Is it a dotted line or solid line?” • These mean equal to or greater, which is a solid line: ≤ ≥ • These mean less than, which is a dotted line: < > • “What if the equation isn’t simple and has y mixed in with other numbers?” • Balance it out and solve it first before you graph!
If you still have any questions, Mrs. Healey is always available. • Thank you!