Graphing Linear Inequalities
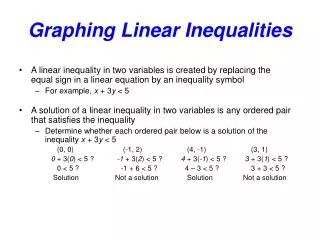
Graphing Linear Inequalities. A linear inequality in two variables is created by replacing the equal sign in a linear equation by an inequality symbol For example, x + 3 y < 5 A solution of a linear inequality in two variables is any ordered pair that satisfies the inequality

Graphing Linear Inequalities
E N D
Presentation Transcript
Graphing Linear Inequalities • A linear inequality in two variables is created by replacing the equal sign in a linear equation by an inequality symbol • For example, x + 3y < 5 • A solution of a linear inequality in two variables is any ordered pair that satisfies the inequality • Determine whether each ordered pair below is a solution of the inequality x + 3y < 5 (0, 0) (-1, 2) (4, -1) (3, 1) 0 + 3(0) < 5 ? -1 + 3(2) < 5 ? 4 + 3(-1) < 5 ? 3 + 3(1) < 5 ? 0 < 5 ? -1 + 6 < 5 ? 4 – 3 < 5 ? 3 + 3 < 5 ? Solution Not a solution Solution Not a solution
8 6 4 2 -8 -6 -4 -2 2 4 6 8 -2 -4 -6 -8 Graphing Linear Inequalities • To graph a linear inequality in one variable such as y > 4 or x≤ -4 on a coordinate plane, start by drawing the horizontal or vertical line for the matching equation • Draw a solid line if the inequality is ≤ or ≥ • Draw a dashed line if the inequality is < or > • This line forms the boundary of the inequality • For example, to graph y > 4 • Draw the dashed boundary line y = 4 • Shade above the boundary line • Graph the inequality x≤ -4 • Draw the solid boundary line x = -4 • Shade to the left of the boundary line y = 4 x = -4
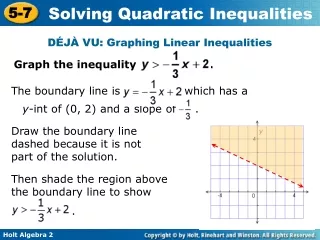
8 6 4 2 -8 -6 -4 -2 2 4 6 8 -2 -4 -6 -8 Graphing Linear Inequalities • To graph a linear inequality such as x + 3y < 5 • Graph the associated equation by replacing the inequality symbol by an equals sign • Test a point on either side of the boundary line • Use the point (0, 0) if it is not on the boundary line • Shade (or cross-hatch) the half-plane that contains solutions to the inequality • Graph the inequality 3x + y≥ 5 • Draw the boundary line for the inequality by graphing the associated equation 3x + y= 5 • Test a point not on the boundary line • If the point you tested works, shade that side • If the point you tested doesn’t work, shade the other side • Example 4 in the textbook shows how to use a linear inequality in two variables to solve a word problem x + 3y = 5 3x + y = 5