Download
1 / 40
400 likes | 509 Vues
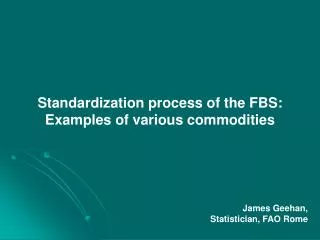
Various examples of Surplus calculation across EU with NOPOLU system2. 10-11 September 2007 Eurostat in Luxembourg. NOPOLU Agri product Presentation. Interest of the agricultural balance calculation.

E N D
Various examples of Surplus calculation across EU with NOPOLU system2 10-11 September 2007 Eurostat in Luxembourg Workshop "Calculating Regional Gross Nutrient Balances"
NOPOLU Agri product Presentation Interest of the agricultural balance calculation • Agricultural practices, such as fertilizing, or animals breeding represent a major source of nutrients and pesticides pollution of the soil, and therefore a potential source of river pollution. • As an example, in some Britanny areas, almost 95% of the Nitrogen pollution into the rivers, comes from agricultural activities. • Agricultural loads, also designated as “surpluses”, are a good indicator of the pressure of those agricultural practices, and consequently a indicator of efficiency of policies. Workshop "Calculating Regional Gross Nutrient Balances"
Principle of the agricultural surpluses computation • An exportation rate (from cultures and animal excretions) and a consumption rate (fertilisers, grass eat by animals) are allocated for every type of crop and every kind of animals. • The distribution can be spatially distributed and even at closer scales, if the coefficients are available. • The calculation : consumption minus exportation corresponds to the agricultural balance. The agricultural surplus load (Gross Balance) is obtained by adding the atmospheric deposition • This surpluses load is a nutrient soil stock, able to be directly brought to the groundwater and the rivers. Workshop "Calculating Regional Gross Nutrient Balances"
NOPOLU Agri Nutrient Balance model principles • Statistics are available at administrative scale, often very aggregated • Crops are grown / managed only on some type of land covers, • Crops and livestock types are under the Eurostat nomenclature, import procedures translate national nomenclatures. • Relationships CLC types / land use can be set generally and locally adjusted • Calculation of yearly balance & surplus (Nitrogen & Phosphorus)… • Desegregation of parameters from any NUTS level to any HYDROLOGIC level using a LAND COVER (CLC, remote sensing….) • Spatial statistics for all rates • Phenomenon modeled; • Symbiotic Fixation • Atmospheric deposition • Synthetic application fertilizersrates are modulated by organic fertilizer application rates • Volatilization of animals excreta in cattleshed, storing areas, pasture field,.. • Basic Data • Agricultural activities and practices (crops, livestocks,…) • Land cover • G.I.S. layer, NUTS & sub-catchments topology Workshop "Calculating Regional Gross Nutrient Balances"
+ Disagregation using soil coverage Watersheds Limits Results at level basinor NUTS Scenarios Surpluses: Disagregation method Census at NUTS level CLC Workshop "Calculating Regional Gross Nutrient Balances"
Allocation of fertiliser and exportation rates per culture in NOPOLU Workshop "Calculating Regional Gross Nutrient Balances"
Large scale assessment of non-point nutrients sourcesusing NOPOLU More than 10 years of experience and models refinements First step: Maturing the model from pilot study to large scale and detailed processes model The objective was to build a tool capable of assessing large scale watersheds agricultural nutrients balances • Pilot application was driven in 1977 on Loire- Brittany basin (157000Km2). The idea was to process the equations for balance calculation from CORPEN institute at sub-catchment level using a disagregation process involving a Land cover ( in fact CLC). • Compatibility to EC nomenclature was implemented and tested on Elbe basin (147000Km2) covering 3 countries (an as much agricultural census) in 1999. • Experience driven by Lunven University for JRC on a large part of Europe permitted to prove to very large scale applicability of the model with very aggregated data (NUTS3) • Many processes were newly modelled in the module since 2003, with SOLAGRO experience. Large-scale assessment with recent datasets RGA 2000 & CLC2000 was then performed on whole France for WFD Characterisation of river basins. • Green Dairy project (2005-2006) has used NOPOLU for assessing impact of pasture on Nitrogen Gross Balances. Workshop "Calculating Regional Gross Nutrient Balances"
Large scale assessment of non-point nutrients sourcesusing NOPOLU More than 10 years of experience and models refinements Latest developments: use of Earth observation data from satellite remote sensing images The objective was to test the possibility of assessing in real time evolution of agricultural practices by updating land covers and census with EO data • Experience driven in GEOLAND project permits to use remote sensing data processed to obtain up-to-date census and Land Cover as basic module datasets. Pilot basin was Adour-Garonne (118000Km2) • Refinements in the module procedures & in remote sensing data processes were implemented in GMES phase one. Saar-Mosel basin was tested and NOPOLU Nitrogen surpluses results were injected in a water quality model. Workshop "Calculating Regional Gross Nutrient Balances"
From CORPEN idea to NOPOLU pilot application • Technical Norms SCEES/CORPEN for fertilizer, excreta rate & export from crops CORPEN rates applied Aurousseau 1995, scénario 3 Workshop "Calculating Regional Gross Nutrient Balances"
Sensivity analysis: Constants and rules No N-fixing With N-fixing Workshop "Calculating Regional Gross Nutrient Balances"
Checking results: Comparison between N fertilizers delivered (SNIE 1990) versus N modeled fertilizer applied • Scénario 1 • Scénario 2 & 3 Workshop "Calculating Regional Gross Nutrient Balances"
Adjustment of constants and rules : Elbe basin Official constants Revised constants Workshop "Calculating Regional Gross Nutrient Balances"
Scenario on Fodder source (1 Elbe Basin) Unlimited supply Limitation by resources Workshop "Calculating Regional Gross Nutrient Balances"
Fodder source (2 Britanny basin) Unlimited supply Limitation by resources Workshop "Calculating Regional Gross Nutrient Balances"
Nitrogen sources Whole France territory • Organic excreta from livestock: 1487 kt • Synthetic fertilizer : 2 506 kt • Atmospheric deposition (EMEP 2000 source): • 670 kt (surface CLC - 14 kg/ha/an), • 430 kt (over arable land) • Symbiotic Fixation : 569 kt Workshop "Calculating Regional Gross Nutrient Balances"
Results over France : Surplus (1 255 kt - 42 kg/ha) & Balance (932 kt - 31 kg/ha) Workshop "Calculating Regional Gross Nutrient Balances"
Result Maize fodder : balance (129 kt - 93 kg/ha) Workshop "Calculating Regional Gross Nutrient Balances"
Results Maize fodder : Surplus (150 kt – 109 kg/ha) Workshop "Calculating Regional Gross Nutrient Balances"
Results Wheat : balance (159 kt - 33 kg/ha) Workshop "Calculating Regional Gross Nutrient Balances"
Results : Wheat Surplus (1 255 kt - 42 kg/ha) Workshop "Calculating Regional Gross Nutrient Balances"
Results : balance (932 kt - 31 kg/ha) Workshop "Calculating Regional Gross Nutrient Balances"
Results : Surplus (1 255 kt - 42 kg/ha Workshop "Calculating Regional Gross Nutrient Balances"
Earth Observation Datasets Era • The surplus (Gross balance) is an indicator of this impact : it is based on crops surfaces and animals census, and fertilizing practices. Detail Agricultural census is done using farmer surveys, they are published every 10 years in France. • The use of remote sensing data appears to be one of the bridge to fill the gap for quickly assessing large scale basin nutrients balance : • It gives nearly real time information. • Its exploitation is much more cheaper and quicker than current process of surveys. • It has been validated on several pilot basins : Adour-Garonne & Saar-Mosel for surpluses assessments. Workshop "Calculating Regional Gross Nutrient Balances"
Earth Observation datasets : prospects Treatment of EO data is done by Infoterra who produced temporal update of Land cover! It allows; • regular update of HYDROSOL soil occupation cover with the support of frequent Spatial units data. • update of agricultural census, after a soil occupation comparison. • Possible update of up-to-date pieces of data, providing a much relevant load calculation. Workshop "Calculating Regional Gross Nutrient Balances"
Method to generate agricultural landcover from MERIS sensor Workshop "Calculating Regional Gross Nutrient Balances"
Interface from MERIS images to NOPOLU Agri • Use of the process chain line developed by INFOTERRA to produce agricultural land cover • Integrated NOPOLU System2 model in the chain Workshop "Calculating Regional Gross Nutrient Balances"
Treatment of Spatial Coverage datasets • The spatial images for 2005 supplied by INFOTERRA detail 4 types of soil occupation : • Winter / Spring • Summer irrigated zones • Summer non irrigated zones • Meadows • These images are used to update the existing agricultural census RGA for year 2000 available at the district scale (NUTS 4). • A table link French Agricultural census codes and the 4 defined soil occupations codes. This allows to perform the link with the European crop codes used in NOPOLU Agri , in order to generate census for other years. • Then the 2000 census can be update for the year 2005 using . • The agricultural module allows not only to get Nitrogen surpluses values and data rates at different scales NUTS or watershed, but also to obtain the same calculation for any type of culture. • Once the watershed census is available, the 2005 census is calculated using surfaces proratas. Workshop "Calculating Regional Gross Nutrient Balances"
Cloudy areas Some earth observations cannotbe processed because of clouds. No soil occupation is then available for these areas. For these areas, the values from the census of year 2000 are used in The calculation. Workshop "Calculating Regional Gross Nutrient Balances"
Results of census update from 2000 to 2005 • The analysis of the updates of crops surfaces are quite interesting since : • Irrigated summer and winter/spring crops surfaces are quite similar to year 2000 census values, with an average variation of less than ± 5% (mostly increases) • Non irrigated summer surfaces and meadows are inferior to the year 2000 census values. For meadows, this difference may come from forest areas used as meadows, which are not identified distinct in CLC. Workshop "Calculating Regional Gross Nutrient Balances"
Note : The balances & surpluses are superior on 2005 calculation, even if crops surfaces are slightly smaller. This difference only comes from the pastures and meadows which receive animal dejections.In both cases, the same number of animals on the pastures, but a different amount of exportations, nearly 46 500 Tons of delta! Results of calculation Workshop "Calculating Regional Gross Nutrient Balances"
Adour Garonne basin results with EO data Density of Agricultural loads (surplus) projected on CLC agricultural areas. Left : Current calculation for 2005. Top : Reference calculation for 2000. Workshop "Calculating Regional Gross Nutrient Balances"
NOPOLU model • Detailed scheme of surpluxes calculation inside NOPOLU System2 model Workshop "Calculating Regional Gross Nutrient Balances"
Saar Mosel Basin: EO data M2.1 (detailed land cover) integration M2.1 product (right) is used as a more detailed alternative to CLC 2000 (left). Its integration is performed by : • Creation of the HYDROSOL file, by performing an intersection between administrative, hydrographical layers and M2.1 product. • Importation of the resulting file into NOPOLU. • Affectation of agricultural census crop and animal types to land cover categories. Workshop "Calculating Regional Gross Nutrient Balances"
Results on Saar Mosel Basin covering 3 countries • Those global results show : • The missing data from the german census. • A global increase of surpluses values, although the increase is not quite important regarding density. • It’s nevertheless important to notice that no changes have been processed regarding animals. • Detailed results can also been examined per crop/animal types and per entity. Workshop "Calculating Regional Gross Nutrient Balances"
Update of Census with EO data Workshop "Calculating Regional Gross Nutrient Balances"
Results on Saar-Mosel Basin Nitrogen Balance density for wheat Workshop "Calculating Regional Gross Nutrient Balances"
Saar-Mosel basin: results for Wheat Export for Wheat crop Organic fertilizer applied Workshop "Calculating Regional Gross Nutrient Balances"
Saar-Mosel basin : results for Maize Density of surplus Density of organic fertilizer applied Workshop "Calculating Regional Gross Nutrient Balances"
Transparent Separate processes Responsive to hypothesis Surpluses checked on large scale areas Response at basin scale Non circular referencing Easily implemented and run Evolving Detailed processes non modelled, especially (denitrification …) Too rough rate spatial variation can introduce strong border difference. NOPOLU Agri : Pros & cons Workshop "Calculating Regional Gross Nutrient Balances"
Merci Workshop "Calculating Regional Gross Nutrient Balances"