Lecture 19 – Numerical Integration
Lecture 19 – Numerical Integration. Area under curve led to Riemann sum which led to FTC. But not every function has a closed-form antiderivative . Using rectangles based on the left endpoint of each subinterval. Using rectangles based on the right endpoints of each subinterval. a. b. a.

Lecture 19 – Numerical Integration
E N D
Presentation Transcript
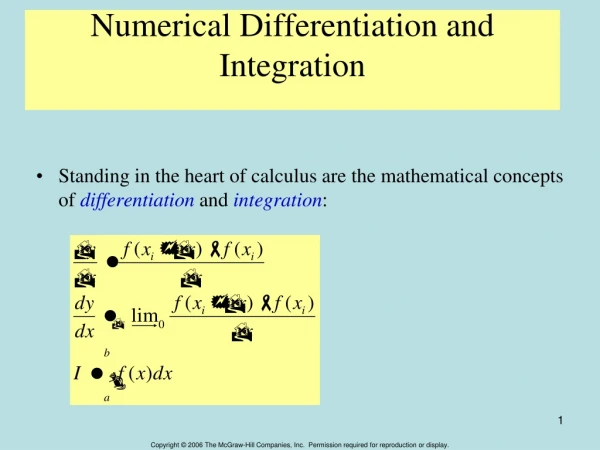
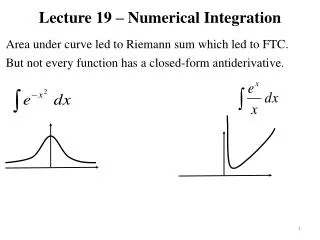
Lecture 19 – Numerical Integration Area under curve led to Riemann sum which led to FTC. But not every function has a closed-form antiderivative.
Using rectangles based on the left endpoint of each subinterval. Using rectangles based on the right endpoints of each subinterval a b a b
Using rectangles based on the midpoint of each subinterval. a b
Use the midpoint rule to estimate the area from 0 to 120. Example 1 8 6 4 2 120
Example 2 f(x) Compare the three rectangle methods in estimating area from x = 1 to 9 using 4 subintervals. 3 4 7 1 2 5 6 8 9 x 1 9
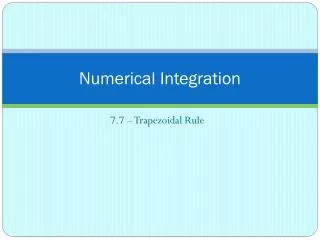
Lecture 20 – More Numerical Integration Instead of rectangles, look at other types easy to compute. Trapezoid Rule: average of Left and Right estimates a b a b a b Area for one trapezoid is (average length of parallel sides) times (width).
Trapezoid Rule is the average of the left and right estimates, so x1 x2 xn-1 xn x0
Simpson’s Rule: weighted average of Mid and Trap estimates – areas under quadratic curves – must break into even number of subintervals – pairs of subintervals form quadratic function a b
Simpson’s Rule is the sum of these areas, so Calculate efficiency of estimates with absolute errors, relative errors, and percent error (change decimal of relative to %).
Use the trapezoid and Simpson’s rules to estimate the integral. Example 3 1 9
Use the M6, T6, and S6 to fill in the table for the given integral. Example 4 2 8