Download
1 / 75

E N D
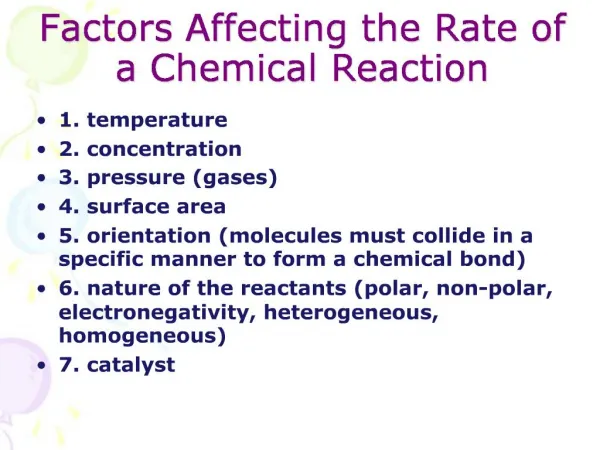
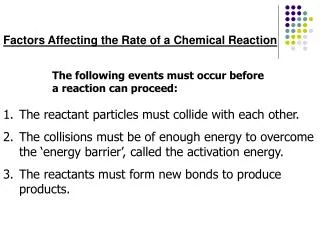
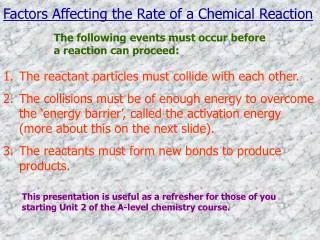
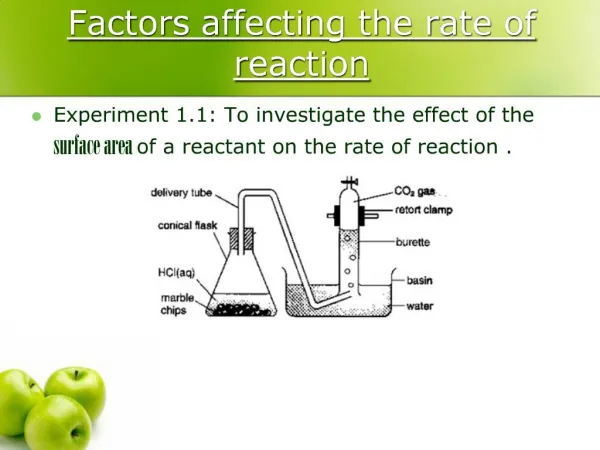
1. Factors affecting the rate of reaction Experiment 1.1: To investigate the effect of the surface area of a reactant on the rate of reaction .
2. Factors affecting the rate of reaction Problem statement
How does the surface area of a solid reactant affect rate of reaction?
3. Factors affecting the rate of reaction Hypothesis
The smaller the size of the reactant particles, that is, the larger the total surface area of the reactant particles, the faster the rate of reaction.
4. Factors affecting the rate of reaction Variables:
(a) Manipulated-variable: Size of the marble chips used
(b) Responding variable : Volume of gas given off at 30-second intervals
(c) Fixed (controlled) variables: Temperature of the experiment, mass of marble chips, concentration and volume of hydrochloric acid.
5. Factors affecting the rate of reaction Apparatus
Conical flask, delivery tube fitted with a rubber stopper, retort stand and clamp, burette, measuring cylinder and stopwatch.
6. Factors affecting the rate of reaction Materials
Marble chips, powdered marble and 0.2 mol dm -3 hydrochloric acid.
7. Factors affecting the rate of reaction Experiment 1
The rate of reaction using large marble chips
Procedure
1 A burette is filled with water and inverted over a basin containing water. The burette is clamped to the retort stand. The water level in the burette is adjusted and the initial burette reading is recorded.
8. Factors affecting the rate of reaction Experiment 1
The rate of reaction using large marble chips
Procedure
2. 5.0 g of marble chips are placed in a small conical flask.
9. Factors affecting the rate of reaction Experiment 1
The rate of reaction using large marble chips
Procedure
3. 50 cm3 of 0.2 mol dm-3 hydrochloric acid is added to the marble chips.
10. Factors affecting the rate of reaction Experiment 1
The rate of reaction using large marble chips
Procedure
4 The delivery tube with a rubber stopper is inserted into the mouth of the conical flask (Figure 1.13). The stopwatch is started simultaneously.
11. Factors affecting the rate of reaction Experiment 1
The rate of reaction using large marble chips
Procedure
5 The burette readings are recorded at 30-second intervals.
12. Factors affecting the rate of reaction Experiment 1
The rate of reaction using large marble chips
Results
13. Factors affecting the rate of reaction Experiment II - The rate of reaction using powdered marble
Procedure
1 Steps 1 to 4 in Experiment I are repeated using 5.0 g of powdered marble. All other conditions such as temperature, volume and concentration of hydrochloric acid are kept constant.
14. Factors affecting the rate of reaction Experiment II - The rate of reaction using powdered marble
Procedure
2 The results of the experiment are recorded in the following table.
15. Factors affecting the rate of reaction Results
Based on the results obtained, a graph of the total volume of carbon dioxide produced against time for each experiment is plotted on the same axes (Figure 1.11).
16. Factors affecting the rate of reaction 1 Figure 1.12 shows the graphs that will be obtained if the reactions in Experiments I and II are completed.
17. Factors affecting the rate of reaction 2 Figure 1.15 shows that both graphs level off at the same value. This indicates that the maximum volume of carbon dioxide collected at the end of reaction for both Experiments I and II are the same (that is, 120 cm3).
18. Factors affecting the rate of reaction 2 Figure 1.15 shows that both graphs level off at the same value. This indicates that the maximum volume of carbon dioxide collected at the end of reaction for both Experiments I and II are the same (that is, 120 cm3). This happens because the masses of the marble and the volumes of the hydrochloric acid used in both the experiments are the same.
19. Factors affecting the rate of reaction 3 The gradient of the graphs for Experiments I and II become less steep as the reactions proceed.
20. Factors affecting the rate of reaction 3 The gradient of the graphs for Experiments I and II become less steep as the reactions proceed. This shows that the rates of reaction
(a) are very high at the beginning of the reaction,
21. Factors affecting the rate of reaction 3 The gradient of the graphs for Experiments I and II become less steep as the reactions proceed. This shows that the rates of reaction
(a) are very high at the beginning of the reaction,
(b) decrease as the reactions proceed,
22. Factors affecting the rate of reaction 3 The gradient of the graphs for Experiments I and II become less steep as the reactions proceed. This shows that the rates of reaction
(a) are very high at the beginning of the reaction,
(b) decrease as the reactions proceed,
(c) become zero when the reactions have completed. At this time, the graphs become horizontal.
23. Factors affecting the rate of reaction 4 The rate of reaction between the marble and hydrochloric acid decreases because
(a) the mass of the remaining unreacted marble decreases.
24. Factors affecting the rate of reaction 4 The rate of reaction between the marble and hydrochloric acid decreases because
(a) the mass of the remaining unreacted marble decreases.
(b) the concentration of hydrochloric acid decreases.
25. Factors affecting the rate of reaction 5 The reaction in Experiment I stops after t2 minutes while the reaction in Experiment II stops after t1, minutes, where t1 < t2. This shows that the rate of reaction for Experiment II (powdered marble) is faster than the rate of reaction for Experiment I (marble chips).
26. Factors affecting the rate of reaction 6 The total volume of carbon dioxide collected in the burette is usually slightly less than the theoretical value.
27. Factors affecting the rate of reaction 6 The total volume of carbon dioxide collected in the burette is usually slightly less than the theoretical value. This is because carbon dioxide is slightly soluble in water. To overcome this problem, a gas syringe is used to collect carbon dioxide released during the experiment (Figure 1.13).
28. Factors affecting the rate of reaction Conclusion:
Graph (II) is steeper than graph (I). This shows that the rate of reaction in Experiment II is faster than the rate of reaction in Experiment I. Powdered marble is used in Experiment II. Thus, the rate is faster with powdered marble than with marble chips. Hence, we can conclude that the smaller the particle size, the larger the total surface area exposed for reaction and the faster the rate of reaction.
29. Concentration Experiment 1.2: To study the effect of concentration on the rate of reaction between sodium thiosulphate solution and dilute sulphuric acid
30. Concentration Problem statement
How does the concentration of a reactant affect the rate of reaction between sodium thiosulphate and dilute sulphuric acid?
31. Concentration Hypothesis
The more concentrated the sodium thiosulphate solution, the higher the rate of reaction.
32. Concentration Variables
(a) Manipulated variable: Concentration of sodium thiosulphate solution
33. Concentration Variables
(a) Manipulated variable: Concentration of sodium thiosulphate solution
(b) Responding variable: Time taken for the cross 'X' to disappear
(c) Fixed (controlled) variables: Concentration and volume of dilute sulphuric acid as well as the temperatures of the solutions.
34. Concentration Apparatus
10 cm3 and 100 cm3 measuring cylinders, 100 cm3 conical flask, white paper marked with a cross 'X', and stopwatch.
35. Concentration Materials
0.2 mol dm -3 sodium thiosulphate solution, 1.0 mol dm-3 sulphuric acid and distilled water.
36. Concentration Procedure
1 50 cm3 of 0.2 mol dm-3 sodium thiosulphate solution is measured out using a 100 cm3 measuring cylinder. The solution is then poured into a clean, dry conical flask.
37. Concentration Procedure
2 The conical flask is placed on a piece of paper with across `X' marked on it (Figure 1.14).
38. Concentration Procedure
3 5 cm3 of dilute sulphuric acid is measured out by using a 10 cm3 measuring cylinder. The acid is then quickly poured into sodium thiosulphate solution. The stopwatch is started immediately.
39. Concentration Procedure
4 The reaction mixture is swirled once and the cross `X' is viewed from above. A yellow precipitate will appear slowly in the conical flask.
40. Concentration Procedure
5 The stopwatch is stopped as soon as the cross disappears from view and the time taken is recorded.
41. Concentration Procedure
6 Steps 1 to 5 are repeated with different mixtures of sodium thiosulphate solution and distilled water as shown in the following table.
42. Concentration Results
43. Concentration Discussion
1. Sodium thiosulphate, Na2 S2 O3 , reacts with dilute sulphuric acid according to the equation:
Na2S2O3(aq) + H2 SO4(aq) ? Na2SO4(aq) + H2O(l) + SO2(g) + S(s)
44. Concentration Discussion
1. Sodium thiosulphate, Na2 S2 O3 , reacts with dilute sulphuric acid according to the equation:
Na2S2O3(aq) + H2 SO4(aq) ? Na2SO4(aq) + H2O(l) + SO2(g) + S(s)
The ionic equation is as follows:
S2O32- (aq) + 2H+ (aq) ? S(s) + SO2(g) + H2O(l)
The sulphur is precipitated as fine particles and causes the solution to turn cloudy.
45. Concentration Discussion
2 As the amount of sulphur increases, the cross `X' becomes more and more difficult to see. Finally, the cross `X' disappears from view when a certain mass of sulphur is precipitated. Hence, the time recorded for the disappearance of the cross `X' is the time taken for the formation of a fixed mass of sulphur.
46. Concentration Discussion
3 Rate of reaction =
47. Concentration Discussion
4 The concentration of sodium thiosulphate solution after mixing with water can be obtained by using the following formula:
Concentration of Na2S2O3
=
48. Concentration Discussion
5 Based on the experimental results obtained, two graphs can be plotted.
(a) The graph of concentration of sodium thiosulphate against time
(Graph I, Figure 1.15).
49. Concentration
50. Concentration 6 The conical flask used for each experiment must have the same size (for example, 100 cm3 volume). If the conical flask of a larger size (for example, 250 cm3 volume) is used, the time, t, taken for the cross `X' to disappear will increase. When the diameter of the bottom of conical flask increases, a greater amount of sulphur must be formed for the cross `X' to disappear. Conversely, if a smaller conical flask (for example, 50 cm3 volume) is used, the time taken for the cross to disappear will be shorter.
51. Concentration 7 If the experiment is repeated with dilute sulphuric acid of different concentrations, but the concentration of sodium thiosulphate is kept constant, the rate of reaction will also be directly proportional to the concentration of the acid used.
52. Concentration Conclusion
1 From graph I, we can conclude that:
(a) the higher the concentration of sodium thiosulphate, the shorter the time taken for a certain mass of sulphur to he precipitated, that is, for the cross `X' to disappear from view.
53. Concentration Conclusion
1 From graph I, we can conclude that:
(b) This means that the higher the concentration of sodium thiosulphate, the faster the rate of reaction.
54. Concentration Conclusion
2 From graph II, it can be concluded that the concentration of sodium thiosulphate is directly proportional to
Concentration of Na2S2O3 ���.(1)
55. Concentration
3 But the rate of reaction is ����(2)
Hence, combining equations (1) and (2), we have, concentration of Na2S2O3 ? ? reaction rate.
That is, rate of reaction ? concentration of Na2S2O3 solution. The hypothesis is accepted.
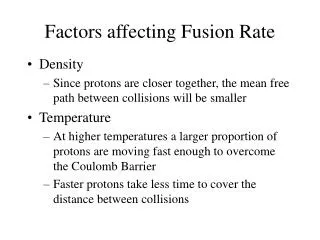
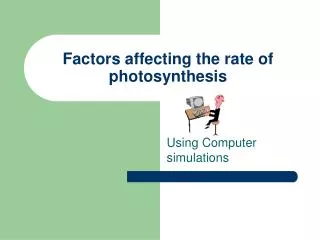
56. Temperature Experiment 1.3: to study the effect of temperature on the rate of reaction between sodium thiosulphate solution and dilute sulphuric acid
57. Temperature Problem statement
How does temperature affect the rate of reaction between sodium thiosulphate solution and sulphuric acid?
58. Temperature Hypothesis
The higher the temperature of the reactant, the faster the rate of reaction.
59. Temperature Variables
(a) Manipulated variable: The temperature of sodium thiosulphate solution
60. Temperature Variables
(b) Responding variable: The time taken for the cross `X' to disappear
(c) Fixed (controlled) variables: The concentrations and volumes of both sodium thiosulphate solution and dilute sulphuric acid
61. Temperature Apparatus
Conical flask, 10 cm3 measuring cylinder, thermometer, stopwatch, white paper marked with a cross `X', wire gauze, tripod stand, and Bunsen burner.
62. Temperature Apparatus
Conical flask, 10 cm3 measuring cylinder, thermometer, stopwatch, white paper marked with a cross `X', wire gauze, tripod stand, and Bunsen burner.
63. Temperature Materials
0.1 mol dm-3 sodium thiosulphate solution and 1.0 mol dm-3 sulphuric acid.
64. Temperature Procedure
Experiment I
Rate of reaction at room temperature
1 50 cm3 of 0.1 mol dm-3 sodium thiosulphate solution is measured out using a 100 cm3 measuring cylinder, and poured into a clean, dry conical flask. The temperature of the sodium thiosulphate solution is measured with a thermometer.
65. Temperature Experiment I
Rate of reaction at room temperature
2 The conical flask is placed on a white paper marked with a cross 'X' (Figure 1.17).
3 5 cm3 of l mol dm-3 sulphuric acid is measured out using a 10 cm3 measuring cylinder. The acid is then quickly poured into the sodium thiosulphate solution.
66. Temperature Experiment I
Rate of reaction at room temperature
4 The stopwatch is started immediately and the conical flask is swirled gently.
5 The cross 'X' is viewed from above. The stopwatch is stopped as soon as the cross disappears from view and the time taken is recorded.
67. Temperature Experiment II to V
6 The solution in the conical flask is poured out. The conical flask is washed thoroughly and dried. 50 cm3 of 0.1 mol dm-3 sodium thiosulphate solution is poured into the conical flask. The solution is heated over a wire gauze until the temperature reaches about 45 �C (Figure 1.18).
68. Temperature Experiment II to V
Rate of reaction at temperatures above room temperature
7 The hot conical flask is placed over a white paper marked with a cross X.
8 5 cm3 of 1 mol dm-3 sulphuric acid is measured out using a 10 cm3 measuring cylinder.
69. Temperature Experiment II to V
Rate of reaction at temperatures above room temperature
9 . When the temperature of sodium thiosulphate solution falls to 40 �C, the sulphuric acid is quickly poured into the thiosulphate solution. The stopwatch is started immediately and the conical flask is swirled gently.
70. Temperature Experiment II to V
Rate of reaction at temperatures above room temperature
10 The cross 'X' is viewed from the top and the time taken for the cross to disappear from view is recorded.
11 Steps 6 to 9 are repeated at higher temperatures as shown in the following table.
71. Temperature Results
72. Temperature Results
Based on the results of the experiment, a graph temperature of sodium thiosulphate solution against
is plotted (Figure 1.19).
73. Temperature Conclusion:
1 The graph shows that the temperature of sodium thiosulphate solution is proportional (but not linearly) to
74. Temperature Conclusion:
2 Temperature ... (1)
But rate of reaction ... (2)
Combining equations (1) and (2), we have,
Rate of reaction ? temperature
75. Temperature Conclusion:
3 The higher the temperature of the experiment, the faster the rate of reaction.