Download
1 / 8
80 likes | 233 Vues
Discussion: Use of ecosystem level productivity as a fishery management tool. New England Not used in management, but currently under consideration for use in management Mid-Atlantic Likely to be under consideration in the near future South Atlantic Never considered Gulf of Mexico

E N D
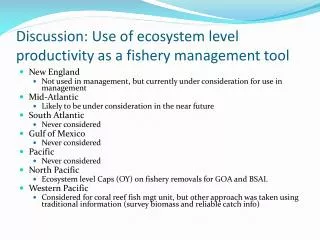
Discussion: Use of ecosystem level productivity as a fishery management tool • New England • Not used in management, but currently under consideration for use in management • Mid-Atlantic • Likely to be under consideration in the near future • South Atlantic • Never considered • Gulf of Mexico • Never considered • Pacific • Never considered • North Pacific • Ecosystem level Caps (OY) on fishery removals for GOA and BSAI. • Western Pacific • Considered for coral reef fish mgt unit, but other approach was taken using traditional information (survey biomass and reliable catch info)
Further Details • New England Estimates of ecosystem level production have been produced using various approaches Estimates are reasonably consistent over time Not directly used in management (contextual use in groundfish management) Updated estimates for various regions have been updated using improved methods The NEFMC is scheduled to vote on whether the production of the system should be used in management
North Pacific • 2million t OY cap for BSAI Groundfish • Adopted in 1982 based on 85% of MSY range of 1.4-2.0 mill t • Has constrained total catch in some years • Numerous proposals made to increase the upper limit 1984-1990 – rejected due to concerns about biological information, market concerns, impacts on marine mammals and seabirds • Upper limit now codified in legislation – difficult to change GOA OY Cap Not constraining Recent MS production model analysis (Mueter and Megrey 2006) indicate BS OY upper limit is reasonable but GOA limit is too high
Maximum Economic Yield • MEY is usually more conservative than MSY (i.e., BMEY ≥ BMSY ) in conventional bioeconomicmodels … • Rationale for ACLs as ‘win-win’ strategy (Grafton et al. 2007) • However conventional bioeconomic models treat population as single (dynamic) variable • MEY was extended using explicit population dynamics models for Bristol Bay Red King Crab and Eastern Bering Sea Snow Crab • New fully dynamic and stochastic bioeconomic models that formally treat decision-making under uncertainty (e.g., ex-vessel prices, recruitment) • Estimated using maximum likelihood methods from time series analysis • Could include Bayesian analysis, MCMC, etc. (future work) • Useful for formal probabilistic assessment and other applications • Two-stock BBRKC-EBSSC bioeconomic model is underway to estimate joint MEY
Risk Analysis • Modern portfolio theory and other tools for analyzing financial time series are applicable to fisheries • For example, risk-return frontiers (i.e., Markowitz Bullet) summarize tradeoffs and can be used to assess outcomes … • Can use prices to aggregate across spp. and combine frontiers • ACLs can shift the risk frontier
Most US control rules are of the “threshold” form, i.e. The ABC is then (roughly) F * B Multispecies F40% (FMSY proxy)
A multispecies “F35% = FMSY” strategy • Divide the species into “key target” (e.g. Pacific cod; walleye pollock; arrowtooth flounder) and “other species”. • Compute mean recruitment (e.g. age 1) since 1978 from the assessment. • Project the model ahead (with multispecies interactions) given virgin recruitment to estimate “multispecies virgin biomass”. • Set the Fs for the “other species” to averages over recent years. • Solve the Fs for the “key target” species so that:
Pros and Cons of System OY • Pros • Takes ecosystem properties into account • Adds conservatism • If economic considerations are included it meets full definition of OY • Cons • Doesn’t limit harvest of individual groups within the system in an ecologically meaningful way • Quantitative methods used don’t always relate to the way individual stocks are managed (i.e., production models vs. age structured models) • Still in early stages of quantitative system level MEY estimates