Phase I Clinical Trials
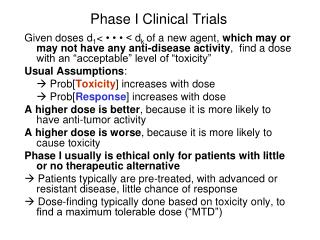
Phase I Clinical Trials. Given doses d 1 < • • • < d k of a new agent, which may or may not have any anti-disease activity , find a dose with an “acceptable” level of “toxicity” Usual Assumptions : Prob[ Toxicity ] increases with dose Prob[ Response ] increases with dose

Phase I Clinical Trials
E N D
Presentation Transcript
Phase I Clinical Trials Given doses d1< • • • < dk of a new agent, which may or may not have any anti-disease activity, find a dose with an “acceptable” level of “toxicity” Usual Assumptions: Prob[Toxicity] increases with dose Prob[Response] increases with dose A higher dose is better, because it is more likely to have anti-tumor activity A higher dose is worse, because it is more likely to cause toxicity Phase I usually is ethical only for patients with little or no therapeutic alternative Patients typically are pre-treated, with advanced or resistant disease, little chance of response Dose-finding typically done based on toxicity only, to find a maximum tolerable dose (“MTD”)
A Typical Phase I Trial 1) Treat patients in cohorts of 1, 2, or 3 2) The investigator chooses the starting level based on clinical judgment, & possibly animal or in vitro data 3) Escalate & de-escalate using “sensible” rules based on a binary indicator of toxicity 4) Do not skip untried dose levels when escalating 5) If the lowest dose is too toxic, stop the trial, or add lower dose levels
Example: A Renal Cell Cancer (RCC) Trial Patients with renal cell cancer, progressive after treatment with Interferon Rx = Fixed dose of 5-FU + one of 6 doses of Gemcitabine, {100, 200, …, 600} mg/m2 Toxicity = Grade 3,4 diarrhea, mucositis, or hematologic toxicity Nmax = 36 patients, treated in cohorts of 3 Start the with1st cohort treated at 200 mg/m2
3+3 Algorithm “A”Implicitly targets a dose with Pr(Toxicity) < .17
3+3 Algorithm “B”Implicitly targets a dose with Pr(Toxicity) < .33
Bayesian Adaptive Dose-Finding 1) Formulate a model for p(x,q) = P(toxicity at dose x | q) 2) Physician specifies Target p, and/or possibly an upper limit Doses, and a starting dose Maximum sample size, and cohort size Information to establish prior(q) 3) Use Bayesian Probability Calculus and a Decision Algorithm to choose doses adaptively for successive patients or cohorts, using previous patients’ data 4) The dose chosen at the end is the “MTD” 5) Computer Simulation: Calibrate design parameters to obtain good Operating Characteristics : Sample Size and Pr(Select) at each dose, Pr(Stop the Trial Early)
Continual Reassessment MethodO’Quigley. Pepe and Fisher, 1990 1) Specify skeleton of fixedToxicityprobabilities p1 < p2 < … < pk corresponding to the k dose levels 2) Specify pTOX* = a target Pr(Toxicity) 3) Prob(Toxicity | dose j) = {pj }exp(a), j=1,…,k, where a ~ N(0,s2), typically with s2 = 2. 4)p(xj,a) = {pj }exp(a) does not depend on the numerical value of the jth dose xj 5) Treat each successive patient (or cohort) at the dose j* for which E[{pj* }exp(a) | data] is closest to pTOX*. 6) The dose satisfying (4) at the end of the trial is the selected to be the MTD 7) Skeleton (p1,…,p6) = (.15, .25, .40, .60, .75, .85) for the RCC trial
A Remark On “Skeletons” (p1,…,p6) & (p1c,…,p6c) give the same model – they just start at different priors. Example: The two skeletons (.15, .25, .40, .60, .75, .85) & (.15, .25, .40, .60, .75, .85)2 = (.0225, .0625, …,.7225) give the same model. Given prior a~N(0,2), the two skeletons just start at different priors on { p1exp(a), p2exp(a), …, p6exp(a) } So there are really equivalence classes of skeletons.
CRM with Bayesian Logistic Regression Model Prob(Toxicity | dose j) = exp{ m+bxj } p(xj,q) = 1 + exp{ m+bxj } q = (m, b) , xj = log(dj) - {S j=1,…klog(dj)}/k m ~ N(nm, sm2), b ~ N(nb, sb2)
CRM with Bayesian Logistic Regression Model Priors: Elicit two mean probabilities. In the RCC trial, the elicited values were E{p(200,q)} = .25 and E{p(500,q)} = .75 Set sm= sb = 2 and solve for E(m) and E(b) • m ~ N(-.13, 4), b ~N(2.40, 4) • Prior effective sample size = 2.3 As in the CRM, specify a target Pr(Toxicity) = pTOX* Treat each cohort at the dose j* for which E{p(xj*,q) | data} is closest to p*TOX The dose chosen at the end of the trial is the MTD
Likelihood and Posterior datan = (Y1, x[1] ), …, (Yn, x[n] ) x[j] = dose and Yj = 1 if toxicity, 0 if not for jth patient p(x,q) = Prob(Toxicity | dose x, q) under the assumed model Lik (datan|q) = Pj{p(x[j],q)}Yj {1-p(x[j],q)}1-Yj Posterior (q| datan) = const. x Lik (datan|q) x Prior (q)
Bayesian Learning: Posteriors based on each of the possible toxicity data sets from 3 patients Uninformative beta(½, ½ ) prior on q = Pr(toxicity)
Bayesian Learning: “33% Toxicity” Posteriors onq = Pr(toxicity)for 4 different observed data sets
Logistics: Some Simple Practical Rules 1. “Look Ahead” – If the outcomes of patients in the current cohort who have been treated but not yet evaluated will not change the next selected dose, treat the next cohort now 2. “Don’t Wait” - Use the most current posterior based on the most recent data available when a new patient is enrolled. Example: If c=3 but 2 patients in the current cohort have been treated and fully evaluated by the time patient #3 is enrolled, then update the posterior and use this to choose the dose for patient #3.
Hypothetical Cohort-by-Cohort Illustration of the CRM Starting at dose level 2, Using the “Do not skip an untried dose” rule
Computer Simulations: Some Continual Reassessment Method (CRM) Model Curves
Selection Percentages Under C1 “3+3” algorithm A is more likely to select NO dose as the “MTD” True Prob(Toxicity) Dose 100 200 300 400 500 600
Selection Percentages Under C2 “3+3 B” is much more likely to select an unsafe dose as the “MTD” “3+3 A” is much more likely to select an ineffective dose as the “MTD” True Prob(Toxicity) Dose 100 200 300 400 500 600
Selection Percentages Under C3 True Prob(Toxicity) Dose 100 200 300 400 500 600
Selection Percentages Under L1 “3+3” algorithm B is much more likely to select an unsafe dose as the “MTD” “3+3” algorithm A is much more likely to select NO dose as the “MTD” True Prob(Toxicity) Dose 100 200 300 400 500 600
Selection Percentages Under L2 “3+3 B” is much more likely to select an unsafe dose as the “MTD” True Prob(Toxicity) Dose 100 200 300 400 500 600
Selection Percentages Under L3 Both “3+3” algorithms are much more likely to select NO dose as the “MTD” True Prob(Toxicity) Dose 100 200 300 400 500 600
Implicit Assumptions (No model No explicit assumptions!) 1) Pr[Toxicity] with dose Higher doses are worse 2) Pr[Efficacy] with dose Higher doses are better Properties of 3+3 and Similar Algorithms Very intuitively appealing. Easy to implement, no computer program is needed. Produces very small samples Finish phase I quickly! Produces very small samples Very unreliable! Very short memory, wastes a lot of data No explicit target ptox, or upper limit on ptox. Less reliable, and less safe, than the CRM. Just plain wrong if either Pr[Toxicity] or Pr[Efficacy] does not increase with dose
Properties of “the” CRM Much more work to implement than 3+3: a) Many possible models (“Bayesian Model averaging” version of Yin and Yuan is very useful) b) Computer program required for simulations, and during trial conduct 2) Sensitive to choice of model (fixed skeleton and prior) 3) Much more reliable than, and much safer than 3+3 4) Assumes “toxicity” is a binary variable (Although some newer CRM methods allow ordinal toxicity) 4) Ignores efficacy 5) Explicitly assumes Pr(Tox) increases with dose Why not set p* = 0 ?The CRM requires the assumption that Pr(Efficacy) with dose, otherwise the optimal dose would be 0 Useful primarily for cytotoxic agents.
Dose-Finding Based on Multiple OrdinalToxicities (Bekele and Thall, 2004) Problems with Conventional Phase I Methods 1. Conventional methods ignore toxicity severity Example: “Toxicity” = {Grade 3 or 4 Liver Tox} Grade 2 liver toxicity = “No Toxicity” 2. Qualitatively different Toxicities are not equally important : Example: If grade 3 or 4 {Fatigue} and {Myelosuppression + Fever} each is “Toxicity” These are given equal importance in dose-finding
A Phase I Sarcoma Trial • Phase I trial of pre-op external beam radiation (EBR) + gemcitabine for soft tissue sarcoma • Each patient receives EBR of 50 cGy • + 100, 200, …, or 1000 mg/m2 gemcitabine • 36 patients, cohort size = 3 or 4 • First cohort was treated at 400 mg/m2
Toxicities and Elicited Severity Weights Grade 4 Grade 3 Grade 2
Total Toxicity Burden (TTB) TTB = The sum over all toxicities and grades of {Severity Weight} x {Probability of Occurrence} Dose-finding is based on the TTB: Each cohort’s dose is chosen to have Mean {TTB(dose) | data} closest to an elicited target TTB*
Probability Model 1) Y = (Y1, …, Y5 ) where the jth toxicityYj has ordinal severity levels 0 = yj,0 < yj,1<. . . < yj,Cj 2)pj,k(x, q) = Pr(Yj = yj,k |dose=x, q) = Pr(Tox type j occurs at severity level k) 3) Use Correlated GaussianLatent Variables to generate the observed ordinal toxicities Y in the likelihood in order to facilitate the Markov Chain Monte Carlo posterior computations
Probability Model Latent variables Z =(Z1, …, Z5 ) ~ N(Xb, W) E(Zj|x) = bj,0 + bj,1x var(Zj) = 1, W = correlation matrix For cutpoints g j,1 < g j,2 …< gj,Cj , Yj = yj,kifgj,k < Zj < gj,k+1 pj,k(x,q) = Pr(Yj = yj,k | x, q) = F{gj,k+1 – (bj,0+bj,1 x)} – F{gj,k – (bj,0+bj,1 x)}
For j = type of toxicity k = severity level of toxicity j the posterior mean TTB at dose x is E{TTB(x, q) | data} = SjSk wj,kE{pj,k(x, q) | data } Severity weight of level k of toxicity type j