Download
1 / 24
240 likes | 423 Vues
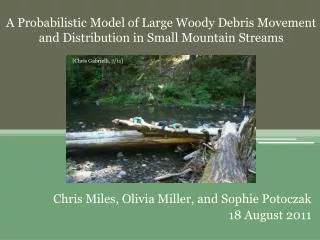
A Probabilistic Model of Large Woody Debris Movement and Distribution in Small Mountain Streams. [Chris Gabrielli , 7/11]. Chris Miles, Olivia Miller, and Sophie Potoczak 18 August 2011. Entry modes LWD accumulation types Historic snagging efforts

E N D
A Probabilistic Model of Large Woody Debris Movement and Distribution in Small Mountain Streams [Chris Gabrielli, 7/11] Chris Miles, Olivia Miller, and Sophie Potoczak 18 August 2011
Entry modes • LWD accumulation types • Historic snagging efforts • River restoration efforts and Engineered Log Jams (ELJ’s) Large Woody Debris (LWD): A History
Why is wood good? • Impacts of LWD • Geomorphologic: • Pools • Migrating bars • Steps, slope • Bank erosion • Median grain size • Ecological: • Protective fish habitat and spawning grounds • Organic matter storage • Infrastructural: • Damaging bridges, scientific monitoring stations ELJ at Quartz Creek near Blue River, OR [Sophie Potoczak, 6/11]
[Sophie Potoczak, 7/11] • Research Objectives: • •Remap sections 1-14 of Lower Lookout to observe changes in wood distributions and channel feature migration between 1977 and today, focusing specifically on changes after the 5-year flood in January 2011 • •Design model to predict what conditions are required for a single piece of woody debris to be mobilized during a flood event • •Ultimately develop a model using the movement model to characterize the distribution of wood in a reach in time • •Potentially simulate future years of wood distribution using the large scale model
[H.J. Andrews] • 5th order stream • Stream gradient 1.5% • 470 m stretch of stream • 14 irregularly spaced transects
[Chris Gabrielli, 7/11] • Wood Mapping: • Measurements taken for pieces > 1m length and 0.1m diameter at breast height (DBH) • DBH taken 1.3m from thickest end • Length, width, height dimensions taken for jams with porosity adjustment • Compass orientations taken for key pieces • Channel Mapping: • Low gravel bars <1m above lowest flow • High gravel bars >1m above lowest flow • Deep, slow-moving or stagnant pools • Secondary or vegetated abandoned channels considered for low-flow conditions [Chris Gabrielli, 7/11]
[Sophie Potoczak, 7/11] • Cross-Sectional Profiles: • Level tape strung from X to Z datum • Depth below line measured every 1 m on bank and gravel bars and every 0.5 m in stream bed • Profiles used to calculate wetted perimeter and cross-sectional area
Mathematical Model • Quantify the probability that a given piece of woody debris of volume V will move in a discharge Q V< 1 m3 V > 1 m3
Mathematical Model Cont’d • integro-differential equation is used to model the dynamics of the LWD distribution on a river stretch of length • is the density of the volume of wood per unit length at point x and time t • is the probability that a log of volume V will move from y to x in the stream reach • is the percent of the volume of wood that enters and exists the stream reach per unit length
Mathematical Model Cont’d • Integrate equation over range of volumes to represent all of the volume classes observed to obtain: • Where and • is quantified by the 2010 wood data through normalizing the volumes over the total volume per cross section length
Mathematical Model Cont’d is frequency at which certain volume classes occur in LOL and the histogram is fit to a log-normal distribution
Mathematical Model Cont’d • The equation is integrated over the length of the stream reach to represent the change on wood volume over the entire reach for one year • is the total change in wood volume in LOL • After integration:the full model for change in wood volume is the following:
Low-flow channel Secondary channel Lower bar Higher bar Lower Lookout Creek 2011: Wood and Channel Map Outline of map courtesy of EISI 2010 (Not a precise scale) Adobe Illustrator CS5.1 used to overlay and refine wood and channel feature maps.
Channel and Wood Distribution Changes from 2010 to 2011 • (following January 2011 flood) • Large dam near XS 11 washed out • Channel-spanning log at XS 4 and XS 1 snapped • New large accumulations at XS 8 and XS 4 • Migrating gravel bars between XS 7-8 and XS 3-4
Sequential maps of LOL over the last 34 years show changes in wood budgets for each section of stream and how channel features are determined by and change in response to presence of LWD Map sources: George Lienkaemper (1977 and 1984); Futoshi Nakamura (1990); John Faustini (1996); Jung-ilSeo, Kristin Kirkby (2010). Figure: Jung-ilSeo
Results: Flood Frequency Analysis Flood Frequency analysis performed via Log-Pearson Type III Analysis from 54 years of annual peak flow data for Lower Lookout Creek
Results: Model Solutions for the relation between the mean travel distance and the input rate using the known change in volume for 2011
Values for the total change in volume (normalized) in one year as a function of the mean travel distance and the input rate
Discussion Movement Model: • Volumes of wood: rootwad? porosity? • Density of wood • Wood probably isn’t always parallel • Critical discharges abnormally low: 89% of wood able to mobilize in 2011 flood, 100% in 1996 • Lack of recent cross section data • Manning’s n estimate potentially off Distribution Density model: • Not enough data to split into good volume classes • Many things not a function of Q (due to only having 2011 data)
Conclusion • Distribution density model can be used to simulate future years • Can be used as a better representation of wood movement for simulations (Streamwood) that influence policy\management
EISI Reflection • Eco-Informatics • Computer Science • Mathematics • Geology • Ecology • Future Groups • Current model is very simplified and can be improved with more accurate data collection
Acknowledgements: Dr. Julia Jones Dr. Jorge Ramirez Dr. Desiree Tullos Travis Roth Dr. Fred Swanson Dr. Mark Schulze Theresa Valentine Matt Cox Chris Gabrielli Dr. John Faustini Greg Downing Dr. Stan Gregory Don Henshaw National Science Foundation Eco-Informatics Summer Institute H.J. Andrews Experimental Forest Oregon State University
References "Andrews Experimental Forest LTER: Data Abstract Detail GS002." Andrews Experimental Forest LTER: Andrews Experimental Forest. 4 Dec. 1990. Web. 15 Aug. 2011. <http://andrewsforest.oregonstate.edu/data/abstractdetail.cfm?dbcode=GS002>. Braudrick C.A. & Grant G.E. (2000) When do logs move in rivers? Water Resources Research, 36, 571–583. Braudrick C.A., Grant G.E., Ishikawa Y. & Ikeda H. (1997) Dynamics of wood transport in streams: a flume experiment. Earth Surface Processes and Landforms, 22,669–683. Czarnomski N.M., Dreher D.M., Snyder K.U., Jones J.A. & Swanson F.J. (2008) Dynamics of wood in stream networks of the western Cascades Range, Oregon. Canadian Journal of Forest Research, 38, 2236–2248. Faustini, J.M., 2000. Stream channel response to peak flows in a fifth-order mountain watershed. PhD Dissertation, Oregon State University, Corvallis. 339 pp. H. J. Andrews Experimental Forest Brochure. 2003. U.S. Forest Service. Web. 14 Aug. 2011. <http://andrewsforest.oregonstate.edu/lter/pubs/pdf/pub3654.pdf>.
Manners RB, Doyle MW. 2008. A mechanistic model of woody debris jam evolution and its application to wood-based restoration and management. River Research and Applications 24: 1104–1123. Martin D.J. & Benda L.E. (2001) Patterns of instream wood recruitment and transport at the watershed scale. Transactions of the American Fisheries Society, 130, 940–958. Meleason, M. A. 2001. A simulation model of wood dynamics in Pacific Northwest streams. Dissertation. Oregon State University, Corvallis, Oregon, USA. Montgomery, D. R., Collins, B. D., Abbe, T. B., and J. M. Buffington. 2003. Geomorphic effects of wood in rivers. Pages 21–47 in S. V. Gregory, K. L. Boyer, and A. Gurnell (Eds.) The Ecology and Management ofWood in World Rivers. American Fisheries Society Symposium 37, Bethesda, MD. Ramirez, Jorge M. 2011. Population persistence under advection-diffusion in river networks. Journal of Mathematical Biology. Accepted, not yet published. "USGS Real-Time Water Data for USGS 14161500 LOOKOUT CREEK NEAR BLUE RIVER, OR." USGS Water Data for the Nation. Web. 15 Aug. 2011. <http://waterdata.usgs.gov/ nwis/dv/?site_no=14161500>.