Balancing Service Capacity and Demand: Management Strategies
320 likes | 395 Vues
Learn about managing service capacity and fluctuating demand through various approaches and strategies to optimize productivity and customer satisfaction.

Balancing Service Capacity and Demand: Management Strategies
E N D
Presentation Transcript
Chapter 9 Lovelock Chapter 9 Balancing Demand and Productive Capacity
From Excess Demand to Excess Capacity Four conditions potentially faced by fixed-capacity services: • Excess demand • Too much demand relative to capacity at a given time • Demand exceeds optimum capacity • Upper limit to a firm’s ability to meet demand at a given time • Optimum capacity • Point beyond which service quality declines as more customers are serviced • Excess capacity • Too much capacity relative to demand at a given time
Addressing Problem of Fluctuating Demand Two basic approaches: • Adjust level of capacity to meet demand • Need to understand productive capacity and how it varies on an incremental basis • Manage level of demand
Variations in Demand Relative to Capacity (Fig 9.1) • Use marketing strategies to smooth out peaks, fill in valleys • Many firms use a mix of both approaches VOLUME DEMANDED Demand exceeds capacity (business is lost) CAPACITY UTILIZED Demand exceeds Maximum Available optimum capacity Capacity (quality declines) Optimum Capacity (Demand and Supply Well Balanced) Excess capacity (wasted resources) Low Utilization (May Send Bad Signals) TIME CYCLE 2 TIME CYCLE 1
Defining Productive Capacity in Services • Physical facilities to contain customers • Physical facilities to store or process goods • Physical equipment to process people, possessions, or information • Labor used for physical or mental work • Public/private infrastructure
Alternative Capacity Management Strategies • Level capacity (fixed level at all times) • Stretch and shrink • Offer inferior extra capacity at peaks (e.g., bus/train standees) • Vary seated space per customer (e.g., elbow room, leg room) • Extend/cut hours of service • Chase demand (adjust capacity to match demand)
Adjusting Capacity to Match Demand • Schedule downtime during periods of low demand • Use part-time employees • Rent or share extra facilities and equipment • Ask customers to share • Invite customers to perform self-service • Cross-train employees
Predictable Demand Patterns and Their Underlying Causes (Table 9.1) Predictable Cycles of Demand Levels Underlying Causes of Cyclical Variations • day • week • month • year • other • employment • billing or tax payments/refunds • pay days • school hours/holidays • seasonal climate changes • public/religious holidays • natural cycles (e.g., coastal tides)
Causes of Seemingly Random Changes in Demand Levels • Weather • Health problems • Accidents, Fires, Crime • Natural disasters Question: Which of these events can be predicted?
Alternative Demand Management Strategies (Table 9.2) • Take no action • Let customers sort it out • Reduce demand • Higher prices • Communication promoting alternative times • Increase demand • Lower prices • Communication, including promotional incentives • Vary product features to increase desirability • More convenient delivery times and places • Inventory demand by reservation system • Inventory demand by formalized queuing
Marketing Strategies CanReshape Some Demand Patterns • Use price and other costs to manage demand • Change product elements • Modify place and time of delivery • No change • Vary times when service is available • Offer service to customers at a new location • Promotion and education
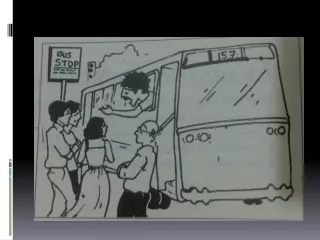
Waiting Is a Universal Phenomenon! • An average person may spend up to 30 minutes/day waiting in line—equivalent to over a week per year! • Almost nobody likes to wait • It's boring, time-wasting, and sometimes physically uncomfortable
Why Do Waiting Lines Occur? • Because the number of arrivals at a facility exceeds capacity of system to process them at a specific point in the process • Queues are basically a symptom of unresolved capacity management problems
Saving Customers from Burdensome Waits • Add extra capacity so that demand can be met at most times (problem: may increase costs too much) • Rethink design of queueing system to give priority to certain customers or transactions • Redesign processes to shorten transaction time • Manage customer behavior and perceptions of wait • Install a reservations system
21 29 28 20 25 30 24 26 31 27 23 32 Alternative Queuing Configurations Single line, single server, single stage Single line, single servers, sequential stages Parallel lines to multiple servers Designated lines to designated servers Single line to multiple servers (“snake”) “Take a number” (single or multiple servers)
Criteria for Allocating Different Market Segments to Designated Lines • Urgency of job • Emergencies versus non-emergencies • Duration of service transaction • Number of items to transact • Complexity of task • Payment of premium price • First class versus economy • Importance of customer • Frequent users/high volume purchasers versus others
Ten Propositions on Psychology of Waiting Lines • Unoccupied time feels longer than occupied time • Pre- and post-process waits feel longer than in-process waits • Anxiety makes waits seem longer • Uncertain waits are longer than known, finite waits • Unexplained waits are longer than explained waits • Unfair waits are longer than equitable waiting • People will wait longer for more valuable services • Waiting alone feels longer than waiting in groups • Physically uncomfortable waits feel longer • Waits seem longer to new or occasional users Sources: Maister; Davis & Heineke; Jones & Peppiatt
Benefits of Reservations • Controls and smoothes demand • Pre-sells service • Informs and educates customers in advance of arrival • Saves customers from having to wait in line for service (if reservation times are honored) • Data captured helps organizations • Prepare financial projections • Plan operations and staffing levels
Characteristics of Well-Designed Reservations System • Fast and user-friendly for customers and staff • Answers customer questions • Offers options for self service (e.g., the Web) • Accommodates preferences (e.g., room with view) • Deflects demand from unavailable first choices to alternative times and locations • Includes strategies for no-shows and overbooking • Requiring deposits to discourage no-shows • Canceling unpaid bookings after designated time • Compensating victims of over-booking