Understanding Capacity Demand and Flow
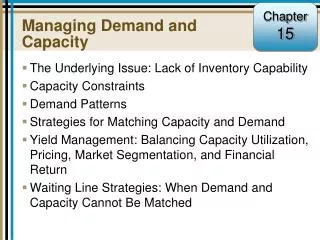
Understanding Capacity Demand and Flow. Essential measures and processes for understanding healthcare. Why Capacity and Demand? Context. Resources are limited and will remain so Increasing pressure to achieve targets How can we achieve more? with current resources?

Understanding Capacity Demand and Flow
E N D
Presentation Transcript
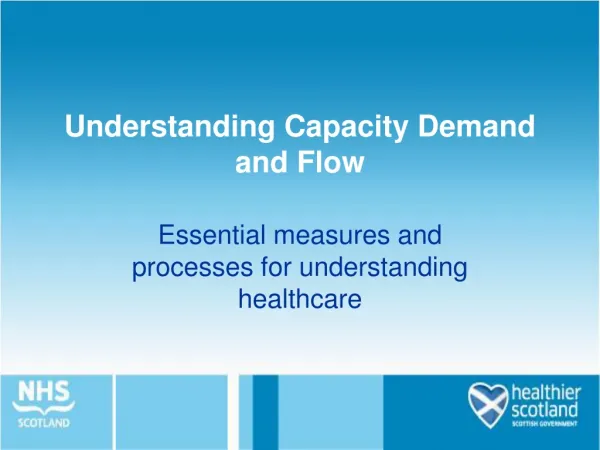
Understanding Capacity Demand and Flow Essential measures and processes for understanding healthcare
Why Capacity and Demand?Context • Resources are limited and will remain so • Increasing pressure to achieve targets • How can we achieve more? • with current resources? • Do we really need more resources? • Do we know?
Map and analyse the patient journey Identify the bottlenecks Measure Activity, Backlog, Capacity and Demand Redesign the bottlenecks Measure and monitor Roadmap for Continuous Improvement
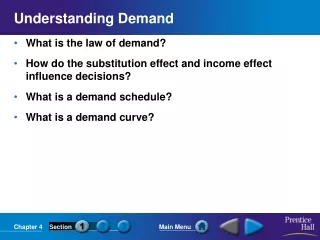
Terms • Bottleneck and Constraint • Demand • Capacity • Activity • Backlog • Segmentation vs Carve Out • Variation • Flow
Capacity resource x time it is available to be used Demand All requests for service from all sources x the time it takes to process a patient Activity number of patients treated x the time it takes to process a patient Queue Waiting list = Queue = Backlog = Work in progress x the time it takes to process a patient Definitions: Bottleneck Currently limits activity Bottleneck or Constraint Whatever defines the capacity
All in the Same Units Measurement Activity Backlog Capacity Demand
Prepare patient Scan patient Get off scanner Report Films Type Report Mapping the journey –How long does a scan take?
How long does a scan take? For a sample of 6 weeks, for every 23 scans done 2 took > 20 minutes
Measure Activity • Keep a daily record...
We don’t need to count these every week 21/23 X 20/60 X 1758 2/23 X 40/60 X 1758 637 hours + = Measure the Queue Convert the queue (waiting list) to time
Measure Capacity Measure available time for each resource
Demand converted to time One appointment type Every patient gets 20min appointment Only those for certain procedures or from ITU get 40 minutes (2 slots) Measure Demand • Measure all demand from all sources • Convert to time
Everything in the same units • Activity converted to hours • Capacity converted to hours • Queue converted to hours • Demand converted to hours For the same time period
Plot everything on the same graph... If activity > demand why do we have a backlog?
Summary • Why measure • What to measure • How to start • How to present it