Understanding Carrying Capacity in Environmental Science
150 likes | 444 Vues
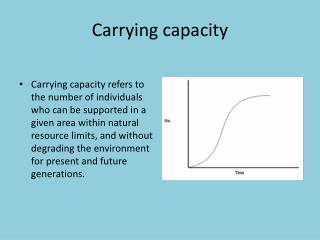
Learn how to predict population changes based on limiting factors and carrying capacity. Discover the significance of food, water, and space in determining the maximum number of organisms an environment can support. Explore aquaculture and carrying capacity graphs to understand population dynamics. See how populations stabilize when reaching their carrying capacity.

Understanding Carrying Capacity in Environmental Science
E N D
Presentation Transcript
Understanding Carrying Capacity Environmental Science
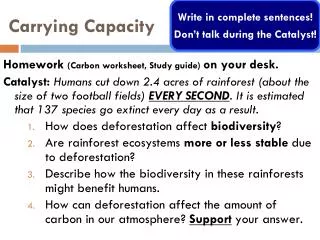
Learning Target • I will predict if population size will increase or decrease based upon limiting factors and carrying capacity.
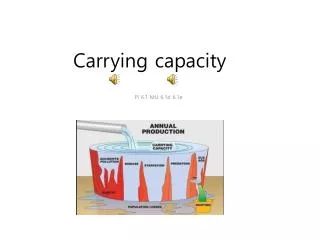
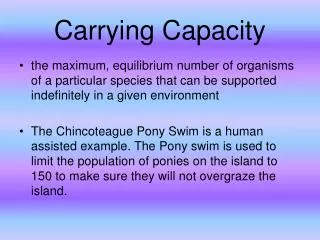
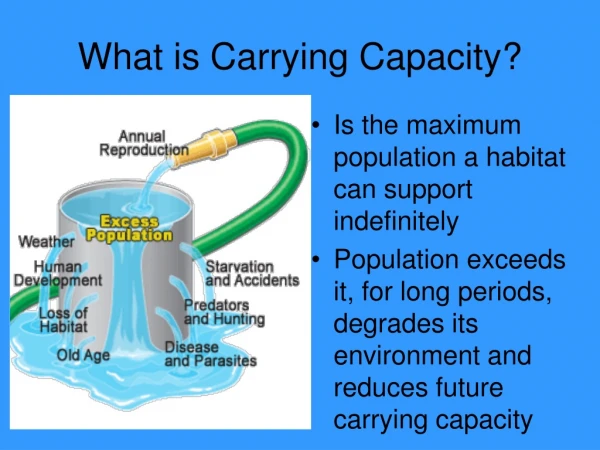
Carrying Capacity • Key Point #1: An environment can only support as many organisms as there is available food, water, and free space • Carrying capacity = maximum number of organisms that can live somewhere, based on the food, water, and free space. • Every species has a different carrying capacity. Food, water, and free space are the LIMITING FACTORS that determine carrying capacity
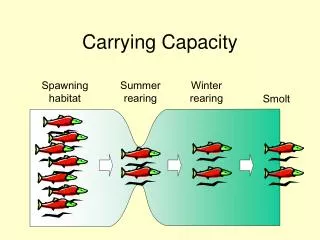
Aquaculture • Aquaculture, also known as aquafarming, is the farming of aquatic organisms such as fish, crustaceans, molluscs and aquatic plants
Population size Dotted line = Carrying Capacity Graph line = Population size at a specific time Time Carrying Capacity • Key Point #2: We can read a carrying capacity graph to predict changes in population size
Population size Time Carrying Capacity • When a population is BELOW its carrying capacity, it will INCREASEin size • Birth rate exceeds death rates
Population size Time Carrying Capacity • But if it increases too much and rises ABOVE its carrying capacity, it will DECREASE in size • Death rate exceeds birth rate
Population size Time Carrying Capacity • When a population is BELOW its carrying capacity, it will INCREASEin size • Birth rate exceeds death rates
Population size Time Carrying Capacity • This happens over and over… but the increases and decreases get smaller and smaller…
Population size Time Carrying Capacity • Until eventually, the population size BECOMES STABLE AT THE CARRYING CAPACITY • Birth rate = death rate
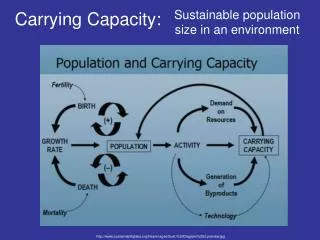
determined by Carrying Capacity Limiting Factors such as above it Food Water Population decreases below it Space Population increases WORD BANK: water, carrying capacity, pop. size increases, limiting factors, food, pop. size decreases, space
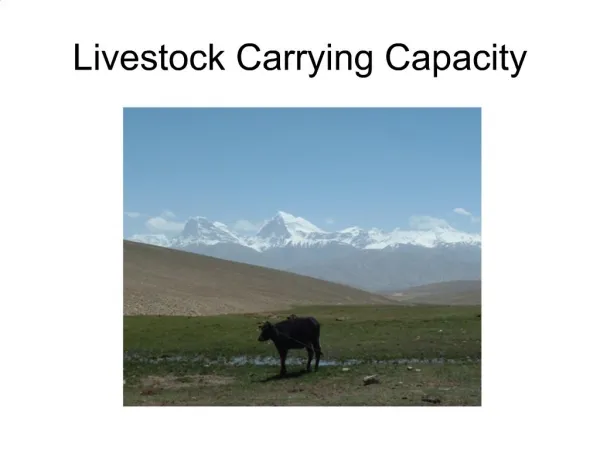
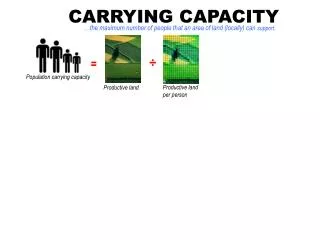
Carrying Capacity • Carrying capacity can also have a broader meaning. It can be defined as the number of living things (plants and animals) any area of land or water can support at any one time. • Different organisms will have different carrying capacities in the same area. Thus, the carrying capacity of an ecosystem affects everything that lives in it.
Closing • An environment can only support as many organisms as there is available food, water, and free space • Carrying capacity = maximum number of organisms that can live somewhere based on these limiting factors • We can read a carrying capacity graph to predict changes in population size • Below carrying capacity = increase • Above carrying capacity = decease • Over time, population stabilizes at carrying capacity