Download
1 / 42
420 likes | 463 Vues
Explore how George Legrady transformed Seattle Public Library through data art, technology, and community involvement. Discover the innovative projects and challenges faced in creating a dynamic data exchange center within a library setting.

E N D
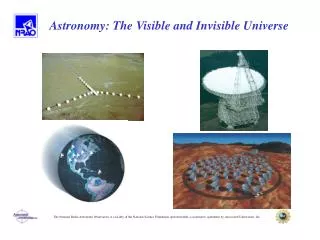
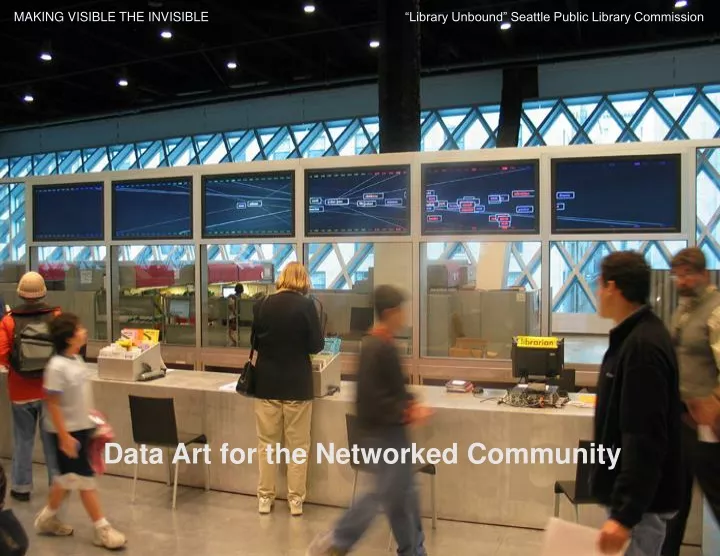
MAKING VISIBLE THE INVISIBLE “Library Unbound” Seattle Public Library Commission Data Art for the Networked Community George Legrady
SPL Library: Architectural InfraStructure Transformations • Rem Koolhaas radical redesign • Open public research computerized spaces • Spiral lay-out book storage stacks • Wired librarians (offices turned into open spaces) • RFID automated checkout and return sorting George Legrady
Book Spiral: Dewey Classification in a Continuous Ribbon George Legrady
Dewey Coded Floor Spiral .jp George Legrady
Automated RF System Check-in, Check-out George Legrady
Librarians Set Loose: Traded Office Space for Commdevice George Legrady
Visualizing the Collective Data Space: The Library As Data Exchange Center George Legrady
Librarians & Visualization George Legrady
“Making Visible the Invisible”, a 10 year Visualization Project 2004-2014 • For the next ten years: Collect hourly circulation of books, analyze the data, and represent through visualizations • Data animations are featured on 6 large LCD panels located on a glass wall horizontally behind the librarians’ main information desk • in the Mixing Chamber, a large open 19,500 sq ft space dedicated to information retrieval and public accessible computer research. George Legrady
Research Phase (fall 2003-spr 2005) • 1 week residency to learn about the library, its operations, etc. • Correlation is madebetween the flow of data (books, DVD) leaving the library and what the community of patrons considers interesting information at any specific time. • The circulation of books is information that can be calculated mathematically and represented visually. George Legrady
What are the Research Questions? • Focus on the library as a “Data Exchange Center” • Information incirculation: Meaning to emerge out of the organization of data • Emergence driven: Localindividual actions (checking out books/dvds) add up to collective positions: representative of the communal thinking! • How to transform the collecting and processing of data into an aestheticexperience: Emphasis on narrative, metaphoric, associative expression • Visualizations: Based on the organization of the data, according to rule-based processes George Legrady
Challenges: Negotiating Data Access, Privacy, Reliability • Libraries & other archival institutions are not used to dynamic artworks that plug into their system for data • Much negotiation with the IT sector for access to data over long time • Obvious main concerns: Security, privacy protection, system integrity, virus protection, maintenance, etc. • Reliability Issue: Project has to be reliable, self-sustaining for the next ten years George Legrady
3 Related Previous Projects: 1992-2001 • An Anecdoted Archive From the Cold War, 1992A collection of historical & personal objects organized according to an invented classification system (Floorplan) • Slippery Traces, 1995Navigation through 250 postcards (classified into 26 chapters) according to multilayered rules inscribed in database (picture within picture navigation links) • Pockets Full of Memories, 2001A dynamically growing collection of artifacts with data sets provided by the public. The objects are dynamically self-organized in a 2D map continuously creating a global order George Legrady
Anecdoted Archive from the Cold War: 1992 • A collection of historical & personal objects organized according to a “hardwired” classification system: Museum floorplan; 8 rooms/chapters; each with 6 to 12 stories; each story has mutiple narratives based on object grouping George Legrady
Slippery Traces: 1995 • 250 postcards organized into 26 chapters. Multilinear relational database structure: Navigation from image to image according to rules inscribed in database with picture within picture navigation links) George Legrady
Pockets Full of Memories: 2001-2006 • A dynamically growing collection of artifacts provided by the public with data sets through a questionnaire. The objects are dynamically self-organized in a 2D Visualization map. Local similarities emerging into a global order. George Legrady
Phase I: Concept & Design Development (2003) | With Andreas Schlegel • Visualizations experimentations: Rapid prototyping rough sketches focused on look and feel of still & animations • Dewey Decimal Classification system • Online Tracking of Flow of data: http://128.111.221.74/parsing/index.php George Legrady
Significant Area: Digital Data Processing / Management • Basic method: [data collection] -> [data processing] -> [visualization] • Bulk of the work: The [data processing] in-between incoming data and the visualization • Data is received every 10 minutes (3000 per hour, 20000 transactions per day) • Operating for the next ten years (2014) <Processing> In:DATA Out:VISUALIZATION George Legrady
Data Processing & Metadata • How: by tracking the circulation of books/media • Require: Regular access to real-time data over long time • Methods: Calculations based on metadata • All books & media (cds, dvds, etc.) are RF tagged • System tracks circulation automatically • Metadata: Catalog Num; bibliography Num; date/time stamps; collection code; itemtype; barcode; title; callNumber; Dewey class; keywords. George Legrady
Dewey Classification System: Ten topics each subdivided into 100 subclasses • 000 - Generalities100 - Philosophy & Psychology200 - Religion300 - Social Science400 - Language500 - Natural Science & Mathematics600 - Technology & Applied Sciences700 - Arts800 - Literature900 - Geography & History • “Untangling my chopsticks” has the Dewey label 641.5952, (placed in the 641 “Food & drink” section) George Legrady
Metadata in XML Format • <transaction> • <itemNumber>1531202</itemNumber> • <bibNumber>2180049</bibNumber> • <ckodate>2005-04-20</ckodate> • <ckotime>16:55:00</ckotime> • <ckidate>2005-05-06</ckidate> • <ckitime>18:21:00</ckitime> • <collcode>nanf</collcode> • <itemtype>acbk</itemtype> • <barcode>0010045801205</barcode> • <title>Untangling my chopsticks, a culinary sojourn in Kyoto</title> • <callNumber>641.5952 R358U 2003</callNumber> • <deweyClass>641.5952</deweyClass> • <subjects> • <subject>Cookery Japanese</subject> • <subject>Japanese tea ceremony</subject> • <subject>Kyoto Japan Social life and customs</subject> • <subject>Food habits Japan Kyoto</subject> • </subjects> • </transaction> George Legrady
Phase II: Visual Exploration & System Planning (2004) | With August Black • System, data storage discussions with SPL IT • Experimentation with graphic visualizations: spectral pulses; radar plots; bezier/spirals, Voronoi variations • Planning the datastructure: its organization, questions of what to look for, what patterns, keywords? George Legrady
Phase III: System Architecture, Design & Production | With Rama Hoetzlein • July 2005: System Architecture: Design and production • Aug 2005: Data Flow Structure and Visualizations (without access to real data) • Sept 5-12, 2005: Seattle Installation: • 1 week to install • First realtime access to data • Hardware/Software synchronization • Interface with IT George Legrady
Rama Hoetzlein: System Development (summer/fall 2005) • System overview (for continuous, large scale data analysis and real-time visualization) • Data Analysis Overview • Keyword Frequency Analysis • Storing Data over time (10 years) • Visualization Processes (Realtime graphics, synchronizataion, data retrieval) • Network Data Flow (Server, clients, data transfer) • Multiple Visualization Timing • Visualization Management (Layered processes, GameX interface) George Legrady
Librarians & Visualization George Legrady
1 _Vital Statistics, Fall 2005 • The day’s and last hour’s circulation activities • 1) Total items, 2) Dewey, 3) Non-Dewey, 4) Books,5) DVD, 6) CD’s and other media • Background color changes with time throughout day • IMPACT: Statistical overview, a form of clock at glance George Legrady
2 _Floating Titles: Fall 2005 • Time based, linear stream of the last hour’s titles, timestamped, spatialized (far, close), and color coded (books, media) • IMPACT: Sequence provides unexpected associations George Legrady
3 _Dot Matrix Rain: Fall 2005 • Non-Dewey titles fall from the top of screen (gravity metaphor), Dewey titles pop up on screen • Finale: Overall Dewey activity trace • IMPACT: Relational overview (for librarians) between Dewey, non-dewey, books, and media. George Legrady
4 _Keyword Map Attack: Fall 2005 • Word Frequency Index of significant title words, and Marc associated keywords, spatially plotted according to Dewey order, color coded, based on usage • IMPACT: Maps topics of interests based on keywords transcending Dewey categories George Legrady
Front and Back Views of the Visualization Installation George Legrady
Challenges for a Ten Year Digital Media Arts Project • What to map to show “Change Over time” • Search for patterns: What exactly to look for? • External correlation (news events)? relevant? • Feedback: How does the visualization impact on circulation? • How do the librarians react to the visualized information, and the participatory need of technical support? George Legrady
Review & Evaluation Issues • Best realization method: Custom software design defined by the task at hand • Collaborative Development requires a particular mindset from participants • Technology changes every 3 years: Long term technological artwork requires maintenance program and budget • Institution must be competent to feature and willing to support technologally complex artworks George Legrady
Credits • Technical Design, Research & Production • Andreas Schlegel, Preliminary interaction Design, website, data organization (2003-2004) • August Black, Preliminary data organization and visualization, system administration (2004-2005) • Rama Hoetzlein/Mark Zifchock Team, Final Engineering design, data organization, and production (Summer 2005) • Sponsors • Seattle Public Library • Seattle Arts Commission • Committee of 33, Seattle • NSF IGERT multimedia Research George Legrady