Download
1 / 48
480 likes | 683 Vues
Measuring Benthic Invertebrate Community Condition in California Bays and Estuaries. Ananda Ranasinghe AnandaR@sccwrp.org Benthic Indicator Development Work Group California SQO Science Team. Objectives. “Healthy Benthic Communities” A “Sediment Quality Objective”

E N D
Measuring Benthic Invertebrate Community Condition in California Bays and Estuaries Ananda Ranasinghe AnandaR@sccwrp.org Benthic Indicator Development Work Group California SQO Science Team
Objectives • “Healthy Benthic Communities” • A “Sediment Quality Objective” • For California bays and estuaries • Today’s goal: • Answer two questions: • How will SQO’s measure benthic health? • How well do the tools work?
Overview • Why Benthos & Benthic Indices? • SQO Benthic Indices • Five candidates • Evaluating Index Performance • Screening-level evaluation • Classification accuracy
Why Benthos? • Benthic organisms are living resources • Direct measure of what legislation intends to protect • They are good indicators • Sensitive, limited mobility, high exposure, integrate impacts, integrate over time • Already being used to make regulatory and sediment management decisions • Santa Monica Bay removed from 303(d) list • Listed for metals in the early 1990’s • 301(h) waivers granted to dischargers • Toxic hotspot designations for the Bay Protection and Toxic Cleanup Program
Benthic Assessments Pose Several Challenges • Interpreting species abundances is difficult • Samples may have tens of species and hundreds of organisms • Benthic species and abundances vary naturally with habitat • Different assemblages occur in different habitats • Comparisons to determine altered states should vary accordingly • Sampling methods vary • Gear, sampling area and sieve size affect species and individuals captured
Benthic Indices Potentially Meet These Challenges • Benthic Indices • Remove much of the subjectivity associated with data interpretation • Account for habitat differences • Are single values • Provide simple means of • Communicating complex information to managers • Tracking trends over time • Correlating benthic responses with stressor data • Are included in the U.S. EPA’s guidance for biocriteria development
Index Approaches • Several factors vary, including • Assumptions • Preconceived notions about relationships E.g., # taxa • Measures considered • Community measures E.g., # taxa, # molluscan taxa, % sensitive species • Species abundances And pollution tolerances • Types of sites required for development • Reference only • Reference and highly disturbed
IBI: Index of Biotic Integrity • Initially developed for freshwater streams • Several subsequent estuarine applications • Based on community measures • Counts # values outside reference range for • SFB: # taxa, # molluscan taxa, total abundance, Capitella capitata abundance • SoCal: # taxa, # molluscan taxa, abundance of Notomastus sp., abundance of sensitive species • Team led by Bruce Thompson (SFEI)
RBI: Relative Benthic Index • Developed for California estuaries • SWRCB’s BPTCP Program • Based on community measures • Weighted sum of • Four community measures • # taxa, # crustacean species, # crustacean individuals, # mollusc species • Three positive indicator species • Two negative indicator species • Team led by Jim Oakden (Moss Landing Lab)
BRI: Benthic Response Index • Developed for southern California (SoCal) mainland shelf • Extended to SoCal bays and estuaries • Abundance-weighted average pollution tolerance score (p-value) • Species p-values assigned during index development • Based on “Good” and “Bad” site information • Abundance distribution along a pollution vector in an ordination space • SoCal benthic team led by Bob Smith
RIVPACS: River Invertebrate Prediction and Classification System • Developed for British freshwater streams • This is the first application in estuaries • Compares sampled species • With expected species composition • Determined by a multivariate predictive model • From assemblages at designated reference sites • Team led by Dave Huff
BQI: Benthic Quality Index • Developed for Swedish west coast • Product of • Log10 # of taxa, and • Abundance-weighted average pollution tolerance • Different than BRI pollution tolerance • Based on species distribution along a richness gradient • SoCal benthic team led by Bob Smith
Data • All indices used the same data • For development • And evaluation • Evaluation data were not used for development • Polyhaline San Francisco Bay • 268 development samples • 12 evaluation samples • Southern California Euhaline Bays • 377 development samples • 24 evaluation samples • 414 other samples
Index Evaluation • Screening-level evaluation • Species richness • Independence from natural gradients • Classification accuracy • Against classification by best professional judgment
Independence From Natural Gradients • Benthic indices should measure habitat condition • Rather than habitat factors • Tested by plotting benthic indices against • Depth • Percent fines • Salinity • TOC • Latitude, and • Longitude • Conclusion • The indices are not overly sensitive to habitat factors
Correlations with Fine SedimentsSouthern California Euhaline Bays
Correlations with Habitat VariablesSpearman Correlation Coefficients
Classification Accuracy • Index results compared to biologist BPJ • Nine benthic ecologists • Ranked samples on condition, and • Evaluated on a four-category scale • Reference; Low,Moderate, and High Disturbance • 36 samples • Covering the range of conditions encountered • On a chemical contamination gradient • Data provided • Species abundances • Region, depth, salinity, and sediment grain size
Advantages of BPJ Comparison • Provides an opportunity to assess intermediate samples • Previous benthic index efforts focused on extremes • Quantifies classification consistency • Provides a means for assessing how well indices are working • The commonly used 80% standard has no basis
Evaluation Process • Two-step evaluation • Quantified expert performance • Condition ranks • Category concordance • Are there “outlier” experts? • Compared index and expert results • Condition ranks • Category concordance • Can developer thresholds be improved?
Condition Rank Correlations Polyhaline San Francisco Bayn=12; p < 0.001 for all cases
Index EvaluationCorrelation of Candidate Index Rank with Mean Rater Rank
Classification Accuracy • How well do candidate indices evaluate condition category? • Assessed at two levels • Status (Good or Bad) • Four-category scale • Reference; Low,Moderate, and High Disturbance
Conclusion • Experts did well • Index combinations did almost as well • Individual indices didn’t do so well • Many index combinations worked well • Four and five generally did better than three • Three generally did better than two did better than one • We selected a combination of four indices • Best performer (tie) • For status: Slightly better than the average expert • For categories: Slightly worse than the average expert
Condition Rank Correlations Southern California Euhaline Baysn=24; p < 0.0001 for all cases
Correlations With No. of TaxaSouthern California Euhaline Bays
Three Step Process • Define Habitat Strata • Identify natural assemblages and controlling habitat factors • Develop Candidate Indices • Apply existing index approaches to habitat-specific data • Evaluate Candidate Indices • With independent data
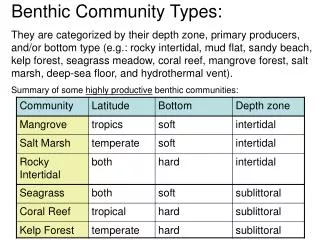
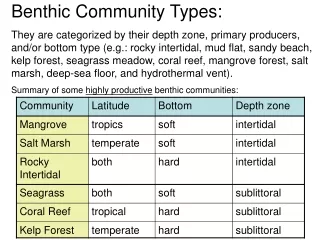
Define Habitat Strata • Rationale • Species and abundances vary naturally from habitat to habitat • Benthic indicators and definitions of reference condition should vary accordingly • Objectives • Identify naturally occurring benthic assemblages, and • The habitat factors that structure them
Approach • Identify assemblages by cluster analysis • Standard choices • Species in ≥ 2 samples • ³√ transform, species mean standardization • Bray Curtis dissimilarity with step-across adjustment • Flexible sorting ß=-0.25 • Evaluate habitat differences between assemblages • Salinity, % fines, depth, latitude, longitude, TOC • Using Mann-Whitney tests
Data • EMAP data enhanced by regional data sets • Comparable methods • Sampling, measurements, taxonomy • OR and WA data included • Potential to increase amount of data for index development • 1164 samples in database • Eliminated potentially contaminated sites • ≥ 1 chemical > ERM or ≥ 4 chemicals > ERL • Toxic to amphipods • Located close to point sources • DO < 2 ppm • 714 samples analyzed