Download
1 / 10
100 likes | 103 Vues
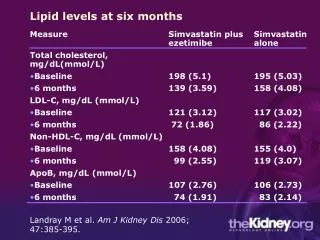
The aim of this study was to evaluate the quality of dry shrimp meat produced by three different methods of the cabinet-type air dryer, oven and under vacuum during six months storage at room temperature. Hence, a non-native species of small-sized shrimp, called Macrobrachium nipponense, was collected from Bandar Anzali international lagoon. Changes in fatty acid profile, proximate composition, physical analysis, sensory evaluation and counting of colonies were studied. The results of chemical and microbial experiments showed that keeping dried shrimp meat under cabinet-type air dryer at ambient temperature was a better method to maintain and improve the quality of dry shrimp meat packed with metalizes films. But the color of dried shrimp meat appeared a little darker. Nevertheless, they gained a good score in the final acceptance by trained panel members. On the other hand, the dried shrimp meat packed under vacuum with metalize films was superior in terms of color and fatty acid compositions than two other methods. In general, the results showed that the type of drying procedure along with the appropriate packaging such as metalize films had a great effect on maintaining the quality and shelf-life of cleaned and dried shrimp meat.

E N D
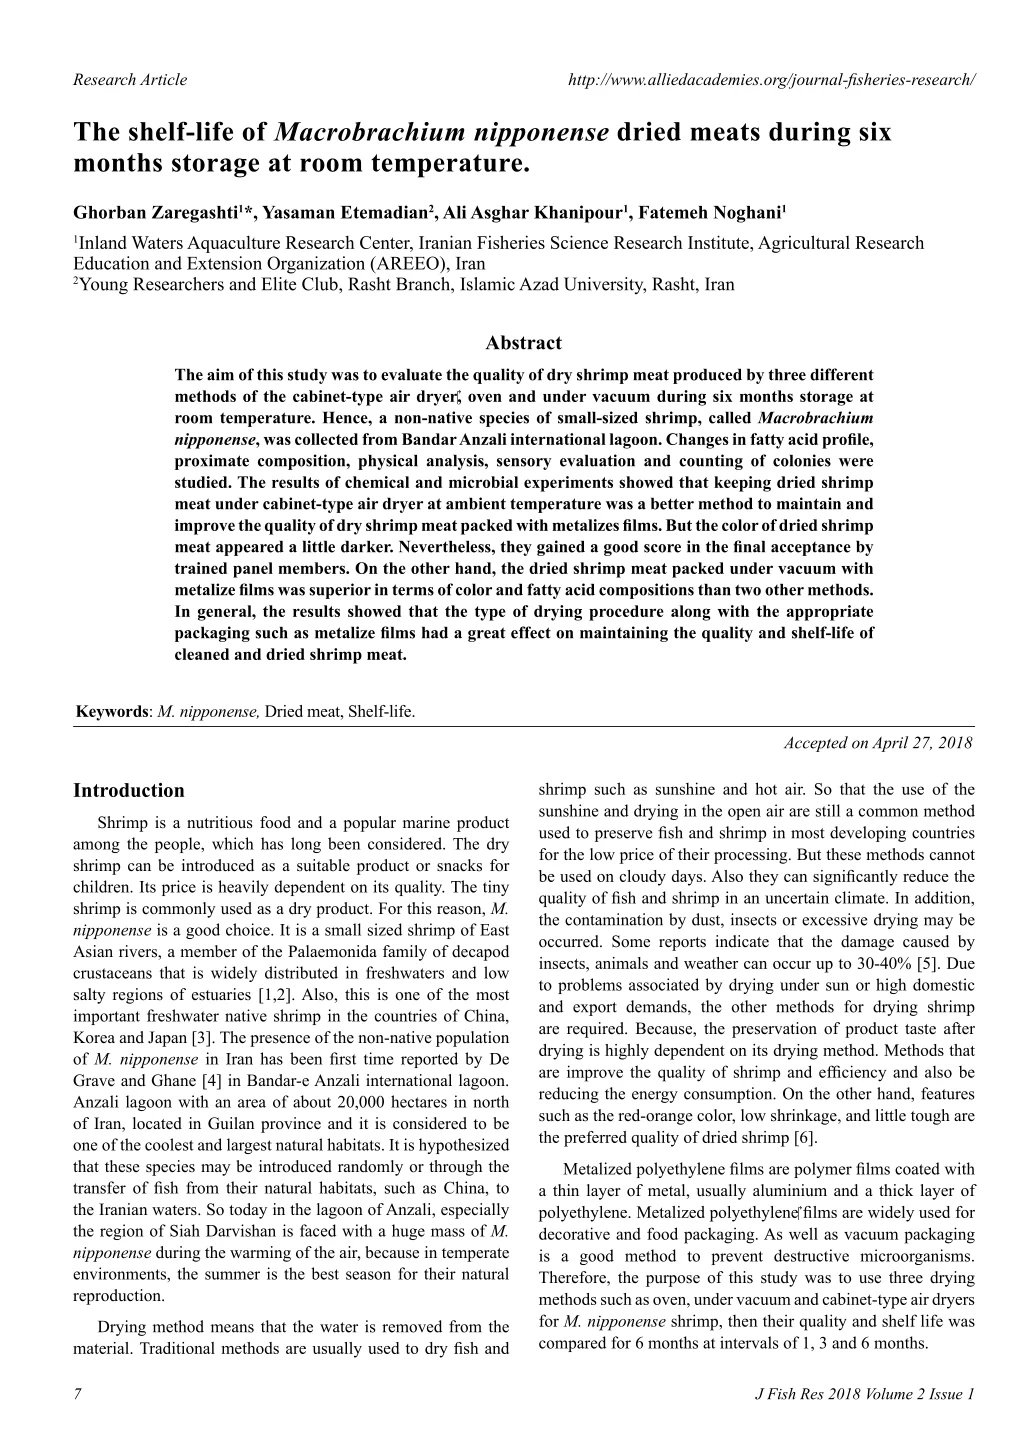
Research Article http://www.alliedacademies.org/journal-fisheries-research/ The shelf-life of months storage at room temperature. dried meats during six Ghorban Zaregashti1*, Yasaman Etemadian2, Ali Asghar Khanipour1, Fatemeh Noghani1 1Inland Waters Aquaculture Research Center, Iranian Fisheries Science Research Institute, Agricultural Research Education and Extension Organization (AREEO), Iran 2Young Researchers and Elite Club, Rasht Branch, Islamic Azad University, Rasht, Iran Abstract The aim of this study was to evaluate the quality of dry shrimp meat produced by three different methods of the cabinet-type air dryer, oven and under vacuum during six months storage at room temperature. Hence, a non-native species of small-sized shrimp, called Macrobrachium nipponense, was collected from Bandar Anzali international lagoon. Changes in fatty acid profile, proximate composition, physical analysis, sensory evaluation and counting of colonies were studied. The results of chemical and microbial experiments showed that keeping dried shrimp meat under cabinet-type air dryer at ambient temperature was a better method to maintain and improve the quality of dry shrimp meat packed with metalizes films. But the color of dried shrimp meat appeared a little darker. Nevertheless, they gained a good score in the final acceptance by trained panel members. On the other hand, the dried shrimp meat packed under vacuum with metalize films was superior in terms of color and fatty acid compositions than two other methods. In general, the results showed that the type of drying procedure along with the appropriate packaging such as metalize films had a great effect on maintaining the quality and shelf-life of cleaned and dried shrimp meat. Keywords: M. nipponense, Dried meat, Shelf-life. Accepted on April 27, 2018 Introduction shrimp such as sunshine and hot air. So that the use of the sunshine and drying in the open air are still a common method used to preserve fish and shrimp in most developing countries for the low price of their processing. But these methods cannot be used on cloudy days. Also they can significantly reduce the quality of fish and shrimp in an uncertain climate. In addition, the contamination by dust, insects or excessive drying may be occurred. Some reports indicate that the damage caused by insects, animals and weather can occur up to 30-40% [5]. Due to problems associated by drying under sun or high domestic and export demands, the other methods for drying shrimp are required. Because, the preservation of product taste after drying is highly dependent on its drying method. Methods that are improve the quality of shrimp and efficiency and also be reducing the energy consumption. On the other hand, features such as the red-orange color, low shrinkage, and little tough are the preferred quality of dried shrimp [6]. Shrimp is a nutritious food and a popular marine product among the people, which has long been considered. The dry shrimp can be introduced as a suitable product or snacks for children. Its price is heavily dependent on its quality. The tiny shrimp is commonly used as a dry product. For this reason, M. nipponense is a good choice. It is a small sized shrimp of East Asian rivers, a member of the Palaemonida family of decapod crustaceans that is widely distributed in freshwaters and low salty regions of estuaries [1,2]. Also, this is one of the most important freshwater native shrimp in the countries of China, Korea and Japan [3]. The presence of the non-native population of M. nipponense in Iran has been first time reported by De Grave and Ghane [4] in Bandar-e Anzali international lagoon. Anzali lagoon with an area of about 20,000 hectares in north of Iran, located in Guilan province and it is considered to be one of the coolest and largest natural habitats. It is hypothesized that these species may be introduced randomly or through the transfer of fish from their natural habitats, such as China, to the Iranian waters. So today in the lagoon of Anzali, especially the region of Siah Darvishan is faced with a huge mass of M. nipponense during the warming of the air, because in temperate environments, the summer is the best season for their natural reproduction. Metalized polyethylene films are polymer films coated with a thin layer of metal, usually aluminium and a thick layer of polyethylene. Metalized polyethylene films are widely used for decorative and food packaging. As well as vacuum packaging is a good method to prevent destructive microorganisms. Therefore, the purpose of this study was to use three drying methods such as oven, under vacuum and cabinet-type air dryers for M. nipponense shrimp, then their quality and shelf life was compared for 6 months at intervals of 1, 3 and 6 months. Drying method means that the water is removed from the material. Traditional methods are usually used to dry fish and 7 J Fish Res 2018 Volume 2 Issue 1
Citation: Zaregashti Gh, Etemadian Y, Khanipour AA, Noghani F. The shelf-life of Macrobrachium nipponense dried meats during six months storage at room temperature. J Fish Res. 2018;2(1):7-16. Materials and Methods Na2SO4 and filtered. The organic solvent was removed and fatty acid methyl ester (FAME) was subjected to gas chromatography (6890 N system, GC Agilent Technologies). Initial temperature was 70°C and then temperature increased to 250°C. The injection temperature was 220°C. Helium was applied as the carrier gas at the flow rate of 1 μl/min. Sample collection and preparation About 45 kg of M. nipponense shrimp was caught from the Siah Darvishan region of Anzali lagoon from 25 June to 20 August, 2016. This place is situated in Guilan, Caspian Sea, Iran; its geographical coordinates are 37°22'56"N, 49°25'20"E. All samples along with ice-water were brought to the laboratory of National Aquaculture Processing Center (UNIDO), Bandar Anzali (Guilan, Iran). The samples were washed with cold water (3°C) to separate dirt, sand and other potential contaminants. Then, the samples were dipped in NaCl solution (10% W/V) with a ratio of 1 to 2 (shrimp: NaCl solution) at boiling temperature for 3 min. After spreading them on leaky trays to remove excess water and cooling for 10 min, they dried at 70°C by three methods, including oven (21 h), under vacuum (7 h) and cabinet-type air dryer (6 h) to obtain less than 10% moisture content. The dried samples after removal of shell, head and tail were under vacuum packaged into metalized polyethylene films. At the end, the samples were stored at ambient temperature for 6 months. Samples were sampled at 1, 3 and 6 months intervals with three replications (Figure 1). Determination of protein The total protein content of shrimp was calculated on the basis of the nitrogen content, which was determined by the micro-Kjeldahl (Behr K20, Germany) system (N×6.25) [8]. Determination of crude lipid Crude lipid was extracted from the shrimp in Soxhlet extractor (Behr, Labor-Technik, Germany) using petroleum ether. The crude lipid content was determined gravimetrically following oven-drying of the extract at 105°C overnight [8]. Determination of ash The ash contents were estimated by heating the samples overnight in a furnace at 525°C for 16 h and weighed [8]. Determination of salt Fatty acid composition 5 g of dried shrimp sample was weighted in a crucible and reduced to ashes in a furnace (Muffle Furnace, SEF-202, Korea) at 550°C until constant mass was obtained. The ash was then cooled and transferred to a volumetric flask. That was washed with distilled water and the volume was adjusted to 100 ml and then filtered by Whatman No. 1 filter paper. 20 ml of it along with a few drops of 10% potassium chromate as an indicator Fatty acid composition of the samples was assessed according to the protocol of Castro et al. [7]. Briefly, 0.075 g of samples was dissolved in 1 ml of toluene and 2 ml of 1% H2SO4 (in methanol). The esters were extracted twice with 5 mL of hexane. The organic layer was separated and washed with 4 ml of 2% KHCO3. The mixture was dried using anhydrous Figure 1. Steps to catch and prepare a dry product from M. nipponense shrimp. J Fish Res 2018 Volume 2 Issue 1 8
Zaregashti/Etemadian was titrated with 0.1 N silver nitrate. The endpoint of titration was red brick color of lees. The salt content (%) was calculated as follows [9-11]: mL silver nitrate 0 005845 100 Salt Sample mass g Determination of moisture into a 100 ml volumetric flask. It was rinsed with chloroform, but was not exceed mark of volumetric. Then it was filled to mark with chloroform. Three 10 ml aliquots of chloroform filtrate were transferred into pre-weighed aluminum drying dishes and allowed to evaporate the solvent. When it was completely evaporated, the dish was placed in an oven at 103°C for one hour. Then after cooling, it was weighted. The remaining volumetric solution was transferred to 250 ml Erlenmeyer flask. It was rinsed with 10 ml chloroform. 70 ml 2-propanol, 35 ml methanol and 8 drops meta-cresol purple indicator were added to it. It was titrated to violet endpoint 0.05 N NaOH. A blank containing all reagents except the sample was titrated. Free fatty acid content was expressed as percent oleic acid [10,13]. × × . = ( ) Value Residual moisture content of shrimp was determined by drying to a constant weight at 105°C in an oven [8]. Determination of thiobarbituric acid (TBA) Thiobarbituric acid substances (TBA) were determined by the steam distillation method [12]. TBA of shrimp was expressed as mg malondialdehyde/kg sample and calculated by using the following formula: Determination of color The color parameters (L* (lightness), a* (redness), b* (yellowness), Chroma and Hue angle) of dried shrimp were measured by using a colorimeter (NR60CP Precision Colorimeter, 3nh, China). Also, the brown index (BI) was calculated by the following formula: ( ( 5 645 3 012 . L a + − = 7 8 Abs × . TBA Value 538 Determination of peroxide value (PV) The peroxide value (PV) was determined by [8] and expressed as milliequivalents of oxygen per 1000 g oil. The PV of samples was calculated by using the following formula: (V2: The volume of sodium thiosulfate used in the titration, N: Normality of sodium thiosulfate, W: Oil weight). V N 1000 PV W Determination of total volatile nitrogen (TVN) ) + * * a 1 75 . L = X ) ( ) Value * * * . b × × ( 0 71 . ) − − 100 x 0 31 . 2 = BI Value Value Sensory evolution Total volatile nitrogen of the samples was determined according to the protocol of Woyewoda et al. [13]. Briefly, 10 g sample and 300 ml distilled water was added to a round bottom distillation flask (1000 ml). After a little shaking the balloons by hand, 2 g magnesium oxide and anti-bumping granules were added to them. To 250 ml Erlenmeyer receiving flask, was added 25 ml of 2% boric acid and a few drops of indicator (dissolve 1 g phenolphthalein in 100 ml ethanol 95%). The distilling flask was heated so that liquid was boiled in exactly 10 min. Using the same rate of heating, was distilled for exactly 25 min. After the distillation, the solution collected in a receiver flask was titrated to purple endpoint 0.1 N H2SO4. Total volatile bases expressed as mg nitrogen per 100 g sample: Sensory evaluation of the samples was performed by 15 panelists based on the 5-point system [14]. At the beginning of the test, they were asked to rinse their mouth with water and then smell and taste the prototypes. Finally, sensory scores were calculated from 0 to 5 for each sample in order to assign a value for the statistical analysis (0=very bad, 1=bad, 2=medium, 3=good, 4=very good, 5=excellent). Counting of colonies Pour plate method was used in this study. This means that the suspension of peptone water (45 ml) with sample (5 g) was prepared at various dilutions. Then, 1 ml of them moved into the sterile plates. Appropriate culture medium with bacteria (Plate Count Agar) and mildew and yeast (Yeast Glucose Chloramphenicol Agar) were pre-sterilized. When their temperature reached to 45°C, about 15-20 ml was added to the plate. The plate was thoroughly mixed by the rotational movement. The plates were incubated at 37°C for 2 days (bacteria) and 23°C for 5 days (mildew and yeast) [15]. Counting of colonies was calculated by the following formula: c V . d + × × × ml sulfuric acid N 100 14 Sample g = TVN ( ) Value Determination of free fatty acid (FFA) To small blender jar, was added 10 g sample, 50 ml chloroform and 50 ml methanol. It was blended 1 minute until finely divided. Then it was filtered on a Buchner funnel through Whatman No. 4 filter paper and rinse with small amount of chloroform. 45 ml distilled water was added to filtrate to achieve a final chloroform/methanol/water ratio of 1:1:1, swirl gently and transferred to 250 ml separatory funnel. The flask was rinsed with chloroform, added washings to separator funnel and left 2 or 3 h (or preferably overnight) at room temperature. After equilibrium, using a regular funnel, slowly was filtered the lower chloroform layer from the separator funnel through a double 15 cm filter paper (Whatman No. 4 inside and Whatman No. 1 outside) half was filled with anhydrous sodium sulfate ∑ = N ( ) Value n 0 1n 1 2 N: the number of microorganisms; c: the total number of colonies counted in all plates selected from two consecutive ranges; V: inoculated volume per plate (ml); n1: the number of plates counted at the first dilution selected; n2: the number of plates counted at the second dilution selected; d: the dilution coefficient is selected based on the first dilution. 9 J Fish Res 2018 Volume 2 Issue 1
Citation: Zaregashti Gh, Etemadian Y, Khanipour AA, Noghani F. The shelf-life of Macrobrachium nipponense dried meats during six months storage at room temperature. J Fish Res. 2018;2(1):7-16. the highest and lowest total fat was respectively observed in oven and under vacuum dried samples. However, there was no statistically significant difference between samples dried under vacuum and cabinet-type air dryers. The amount of shrimp ash in three drying methods included cabinet-type air, oven and under vacuum dryers was also respectively 9.33 ± 0.00, 10.75 ± 0.21 and 12.23 ± 0.55% on dry weight. There was statistically a significant difference between them (P<0.05). On the other hand, the results of this study showed that the amount of ash was high due to the salt adsorption. The salt absorption in the vacuum dryer was higher than other dryers. The moisture of samples in the first time was 6.32 ± 0.07, 8.44 ± 0.14 and 7.24 ± 0.28% in the cabinet, oven and vacuum dryers, respectively. The moisture contents increased with increasing the time (P<0.05). Statistical analysis The statistical analysis was performed using the SAS software. The split plot in time unit was used based on the randomized complete block design. The Duncan’s Multiple Range test (p=0.05) was used to determine any significance of differences between specific means (The SAS System for Windows 9.0, English). All determinations were performed in triplicate, and the data are expressed in terms of mean ± standard deviation (SD). Results Fatty acid composition In this study, the major fatty acids were found (Table 1): palmitic acid- C16: 0-18.49%, 19.06% and 18.63%, stearic acid- C18: 0-13.02%, 13.46% and 14.00%, oleic acid- C18: 1-19.28%, 18.55% and 18.53%, linoleic acid- C18: 2-19.67%, 19.29% and 18.84%, EPA- C20: 5-9.69%, 10.94% and 10.84% and DHA- C22: 6-8.51%, 8.74% and 9.94%, respectively in dried shrimp by the cabinet-type air, oven and under vacuum dryers. In general, the values of the fatty acids of the samples were: SFA (33.36%, 34.31% and 34.75%), MUFA (21%, 20.41% and 20.06%), PUFA (38.92%, 40.13% and 40.83%) and EPA+DHA (18.20%, 19.68% and 20.78%) respectively in dried shrimp by the cabinet-type air, oven and under vacuum dryers. Chemical analysis Changes in the chemical analysis as a result of storage are shown in Table 3. The results showed the thiobarbituric acid content of samples increased during 6 months of storage at ambient temperature. The results of peroxide value in the dried shrimp during six months storage at ambient temperature indicated that the amount of peroxide increased with the increase in the storage time. However, in the first month no peroxide value was recorded in dried samples. But, from the third month onwards, the difference between dried shrimp was significant in the three methods mentioned (p<0.05). However, in between samples, the amount of peroxide in dried samples in both oven and under vacuum dryers was similar and in cabinet-type air dryer samples was lower. Proximate compositions The results of proximate compositions of dried shrimp are presented in Table 2. There was no significant difference in protein contents of dried shrimps by three methods of cabinet- type air (72.74 ± 1.99% dry weight), oven (70.18 ± 1.66% dry weight) and under vacuum (71.18 ± 2.74% dry weight) dryers. The results of total fat measurements showed that The variation of TVN content between samples during storage at ambient temperature showed that the amount of TVN Table 1. Fatty acid compositions of dried shrimps by three methods (cabinet-type air, oven and under vacuum dryers) Fatty acid composition (%) Condition Oven 0.27b ± 0.01 19.06a ± 0.08 13.46b ± 0.01 0.36c ± 0.01 1.16b ± 0.01 Cabinet-type air 0.31b ± 0.01 18.49b ± 0.14 13.02c ± 0.01 0.41b ± 0.01 1.13b ± 0.01 Under Vacuum 0.37a ± 0.01 18.63b ± 0.14 14.00a ± 0.01 0.50a ± 0.01 1.25a ± 0.01 C14:0 C16:0 C18:0 C20:0 C22:0 SFA C16:1 C18:1 C20:1 1.13b ± 0.01 19.28a ± 0.01 0.59b ± 0.01 1.32a ± 0.01 18.55b ± 0.01 0.54c ± 0.01 1.09b ± 0.01 18.53b ± 0.01 0.98a ± 0.01 MUFA C18:2 C18:3 C20:5 C22:6 19.67a ± 0.01 1.05c ± 0.01 9.69c ± 0.01 8.51c ± 0.01 19.29b ± 0.01 1.16b ± 0.01 10.94a ± 0.01 8.74b ± 0.01 18.84c ± 0.01 1.21a ± 0.01 10.84b ± 0.01 9.94a ± 0.01 PUFA The lowercase letters in each row indicate significant differences (p<0.05). Results are expressed as Mean ± SD (n=3) Table 2. Proximate compositions of dried shrimps by three methods (cabinet-type air, oven and under vacuum dryers) Proximate composition Condition Cabinet-type air 72.74a ± 1.99 3.03b ± 0.75 9.33c ± 0.00 3.49c ± 0.07 Oven Under Vacuum 71.18a ± 2.74 2.31b ± 0.36 12.23a ± 0.55 5.68a ± 0.07 Protein (%) Fat (%) Ash (%) Salt (%) 70.18a ± 1.66 3.67a ± 0.58 10.75b ± 0.21 4.83b ± 0.07 The lowercase letters in each row indicate significant differences (p<0.05). Results are expressed as Mean ± SD (n=3) J Fish Res 2018 Volume 2 Issue 1 10
Zaregashti/Etemadian Table 3. Chemical analysis and color measurement of dried shrimps by three methods (cabinet-type air, oven and under vacuum dryers) during 6 months storage at ambient temperature Composition Condition Storage time (months) 1 3 6 Cabinet-type air Oven Under Vacuum 6.32h ± 0.07 8.44f ± 0.14 7.24g ± 0.28 9.97e ± 0.07 12.49c ± 0.16 11.15d ± 0.39 12.32c ± 0.07 15.44a ± 0.14 14.29b ± 0.05 Moisture (%) Cabinet-type air Oven Under Vacuum 0.26ed ± 0.01 0.36c ± 0.01 0.24e ± 0.02 0.28d ± 0.01 0.38c ± 0.01 0.26ed ± 0.02 0.57b ± 0.02 0.68a ± 0.01 0.56b ± 0.03 TBA (mgmalondialdehyde/kg sample) Cabinet-type air Oven Under Vacuum 0.00g ± 0.00 0.00g ± 0.00 0.00g ± 0.00 0.19f ± 0.00 0.25d ± 0.00 0.24e ± 0.00 0.60c ± 0.00 0.75a ± 0.00 0.70b ± 0.00 PV (meq/kg lipid) Cabinet-type air Oven Under Vacuum 6.1b ± 0.03 7.1b ± 0.03 7.5b ± 0.01 7.5b ± 0.13 7.3b ± 0.20 8.9b ± 0.02 14.0a ± 0.57 17.5a ± 0.35 19.0a ± 0.14 TVN (mgN/100 g sample) Cabinet-type air Oven Under Vacuum 11.64c ± 2.52 11.19c ± 1.94 14.24abc ± 2.47 11.68c ± 5.06 13.15bc ± 0.68 17.52ab ± 0.00 14.01abc ± 3.90 16.23ab ± 0.62 17.83a ± 0.29 FFA (% oleic acid) Cabinet-type air Oven Under Vacuum 70.56c ± 1.27 75.48abc ± 0.44 77.05bc ± 0.66 74.28cb ± 1.00 76.13bcA ± 6.55 81.59ab ± 0.99 76.19cb ± 0.54 80.63ab ± 7.26 85.09a ± 1.13 L* Cabinet-type air Oven Under Vacuum 15.75a ± 0.23 12.77cd ± 0.14 14.23b ± 0.06 14.50b ± 0.18 11.36e ± 0.33 13.25c ± 0.57 13.40c ± 0.33 10.35f ± 0.28 12.22d ± 0.54 a* Cabinet-type air Oven Under Vacuum 29.04a ± 0.57 26.48b ± 0.37 27.48b ± 0.00 26.69b ± 0.12 21.64d ± 0.60 24.22c ± 1.28 24.69c ± 0.12 19.64e ± 0.60 21.72d ± 0.57 b* Cabinet-type air Oven Under Vacuum 33.03a ± 0.62 29.40cd ± 0.40 30.94b ± 0.03 30.37bc ± 0.01 24.44f ± 0.69 27.60e ± 1.40 28.31ed ± 0.06 22.24g ± 0.69 25.55f ± 1.33 c Cabinet-type air Oven Under Vacuum 61.53c ± 0.11 64.31a ± 0.08 62.64b ± 0.11 61.48c ± 0.41 62.31b ± 0.04 61.31c ± 0.25 60.35d ± 0.32 60.25d ± 0.01 60.37d ± 0.31 h Cabinet-type air Oven Under Vacuum 140.68f ± 0.00 140.72cd ± 0.00 140.71ed ± 0.00 140.71e ± 0.00 140.74b ± 0.01 140.73b ± 0.01 140.72c ± 0.00 140.76a ± 0.01 140.75a ± 0.01 BI The lowercase letters indicate significant differences (p<0.05). Results are expressed as Mean ± SD (n=3). L*: Lightness; a*: Redness; b*: Yellowness; c: Chroma; h: Hue Angel; BI: Brown index in different treatments increased with increase in the storage time at ambient temperature. This increase was statistically significant (p<0.05). However, there was no significant difference between the different methods of drying during the maintenance period (p>0.05). There was also no difference between the first and third months, but in the sixth month, the effect of time on the samples was significant. was a significant difference between the type of drying methods especially in cabinet-type air and under vacuum dried samples. In general, the amount of FFA increased with increasing time, but no significant difference was observed between the samples. Color analysis Table 3 shows the results of measuring the color in dried shrimp by three different methods: cabinet-type air, the oven, and under vacuum dryers. As the storage time increased, the amount of lightness (L*) increased. In terms of redness and yellowness (a* and b*), the dried shrimp by the cabinet-type air dryer, showed higher values than other two methods. The results of Chroma index or color intensity also showed that with increasing time for 6 months storage, the color intensity The results of measuring FFA in terms of oleic acid content are given in Table 3. The results showed that the amount of FFA was respectively low and high in the dried shrimp by cabinet- type air and under vacuum dryers during 6 months of storage. However, the storage time, except in dried samples by the oven, did not affect other samples. Also, only in the third month there 11 J Fish Res 2018 Volume 2 Issue 1
Citation: Zaregashti Gh, Etemadian Y, Khanipour AA, Noghani F. The shelf-life of Macrobrachium nipponense dried meats during six months storage at room temperature. J Fish Res. 2018;2(1):7-16. shrimp by the oven and vacuum dryers reduced the number of microorganisms and showed statistically a significant difference. Regarding the count of mold and yeast, no mold was observed in any of the samples. But from the third month onwards, the number of yeasts increased from 101 to 102 in dried shrimp by the oven and vacuum dryers. of the samples was decreased and this decrease was statistically significant (p<0.05). There was a significant difference between drying methods. The Hue angle and brown index showed a significant difference between the samples and the increase in storage time. The brown index content in the cabinet-type air dryer was low, that means these samples were darker. Discussion Sensory evolution Figure 2 shows the results of sensory evaluation (color, odor, flavor/taste and texture) of dried shrimp by three methods of under vacuum, the oven and cabinet-type air dryers. Color index of dried shrimp by the cabinet-type air dryer in every three months, as well as odour and texture indexes in dried shrimp by three methods of the oven, under vacuum and cabinet-type air dryers in the first and third months have gained the best grade (5=excellent) by trained panel members. The flavour and taste of dried shrimp in the first month also had a good rating for 6 months. Shrimp generally presents low levels of fatty acids and conversely high levels of cholesterol. However, the results of this study indicated that dry shrimp has good amounts of fatty acids that their absorption by the human body is necessary to deal with many of present diseases, Sampaio et al. [16] also compared the fatty acids profile of fifty samples of salted-dried shrimp species in different seasons (summer, autumn and winter). They reported that these shrimp presented a total of SFA=27.49%, MUFA=43.73%, PUFA=28.79% and EPA+DHA=19.96%. This variation is probably associated to several factors, which are: species, available feeding, age, sex, temperature of the water, geographical location, season, etc. [17], which were also observed by other studies with shrimp [18,19]. Counting of colonies The results of counting the total bacteria (Table 4) showed that with increasing storage time, the number of microorganisms increased. But this increase was in an acceptable range. The dried shrimp by the cabinet-type air dryer compared to dried Analyzing dried shrimp showed that they can be a very rich source of protein and used as a healthy food in the market by Figure 2. Sensory evolution of dried shrimps by three methods (cabinet-type air, oven and under vacuum dryers) during 6 months storage at ambient temperature. Table 4. Microorganism counts of dried shrimps by three methods (cabinet-type air, oven and under vacuum dryers)during 6 months storage at ambient temperature Microorganism count (cfu/g sample) Condition Storage time (months) 3 6.3 × 101b 5.3 × 10²a 3 × 10²a 1 - 6 Cabinet-type air Oven Under Vacuum 1.5 × 10²c 3.2 × 10³b 2 × 10³b Total bacteria 1.1 × 10²a 2 × 10²a Cabinet-type air Oven Under Vacuum - - - - 1.1 × 101b 1.3 × 10²a 1 × 10²a Mildew and yeast 1 × 101b 1 × 101b The lowercase letters in each row indicate significant differences (p<0.05).Results are expressed as Mean ± SD (n=3). -: Nothing was found J Fish Res 2018 Volume 2 Issue 1 12
Zaregashti/Etemadian the consumer. In this study, the results of measuring the protein content of dried shrimp indicated the high protein content. Akonor et al. [20] with study on marine shrimp of Penaeus notialis also reported that protein contents in air-oven-dried and solar-dried shrimp were high and respectively, 85.64 ± 0.26 and 84.89 ± 0.51% on dry weight. The differences in the protein contents of dried shrimp may be attributed to differences in species, growth stage and the season of catching fresh shrimp. Otherwise, the type of drying methods did not make a difference in protein contents. Fat is said to be a range of organic compounds that are naturally found in many daily foods, such as the white meat. The shrimp fat is chiefly made up of polyunsaturated fatty acids [20]. The fat results of this study were lower than fat contents reported by Akonor et al. [20] studies on dried shrimp of Penaeus notialis and Wu and Mao [21] studies on dried grass carp (Ctenopharyngodon idellus) fillets. Ash is a remained mineral material in food. The ash contents of dried samples in the present study were higher than the ash contents reported by Akonor et al. [20] and Wu and Mao [21]. The high contents of ash in dried shrimp of M. nipponense prove the meat of this shrimp is a suitable source of minerals in the diet. On the other hand, the salt measurement was performed to determine the amount of salt residuals after the processing process in dried shrimp. The results revealed that the amount of salt adsorption under vacuum method was more than the other two methods. So that, results of the ash proved this case. Therefore, the drying methods have an effect on the amount of salt absorption. On the other hand, Niamnuy et al. [9] with study on quality changes of shrimp during boiling in the salt solution reported that the salt absorption content in the shrimp meat increased with increasing the boiling time (min). Ensuring safety and preserving food quality during production and maintenance of products for food producers is a major challenge. One of the critical factors that need to be continuously measured and controlled in the production, distribution, and maintenance of food is the moisture, so that the inadequate and high moisture contents in the food packaging and storage environment has a significant effect on reducing the shelf-life of foods. In this study, the results of moisture measurement showed that moisture content increased with increasing storage time at ambient temperature. Also, between different drying methods, the lowest humidity was observed in the cabinet-type air dryer and the highest moisture content in the oven drying method. So, in order to control the increase in the moisture during storage time, the cabinet-type air dryer method was better than other two methods (Table 3). Kamalakar et al. [22] with studies on drying characteristics of prawn and fish reported that with the increase in drying temperature and time, the primary moisture content of the samples decreased. Therefore, a method that can decrease the moisture content of samples to less than 10% at a faster rate has a more effective role in the shelf-life of food products. Iranian Standards Organization (IRI), for lipid oxidation, has identified the maximum 1-2 mg malondialdehyde/kg sample as an acceptable limit in dry products. Also, Greene and Cumuze [24] reported that the values of thiobarbituric acid above 0.6 mg malondialdehyde/kg sample of these products already be detected in the sensory evaluation by trained people. The results showed that with the increase in the storage time, the amount of thiobarbituric acid was increased, but its value in all treatments was within the acceptable limits for 6 months, in fact, less than the maximum declared for lipid oxidation. It can be due to the use of the salt during processing of samples, drying of the product and suitable packaging. Also, there was no significant difference between dried samples in the cabinet- type air and under vacuum dryers in terms of thiobarbituric acid, but there was a significant difference between them and dried samples in oven dried samples. Totally, all treatments were in a good condition in terms of lipid oxidation until the sixth month, except that dried shrimp in oven dryer showed a higher amount of thiobarbituric acid every three months than dried shrimp by two other methods. In another study by Sampaio et al. [16] on cholesterol oxidation in salted and dried shrimp, they observed that the values of thiobarbituric acid vary from 0.02 up to 1.30 mg malondialdehyde/kg sample. Also, Kraemer [25] with a study on the malonaldehyde concentration in salted- dried shrimp reported that the values of thiobarbituric acid were between 0.00 and 1.24 mg malondialdehyde/kg sample. The peroxide value indicates the total amount of hydro- peroxides (the initial product of oxidative changes) and is one of the primary and important indicators for lipid degradation measurements. Huss [26] has suggested that if the peroxide value is above 10-20 (units are ml of 0.002 N sodium thiosulfate required to titrate the iodine liberated from 1 g fat extracted from the fish), then the fish will probably smell and taste rancid. In total, the peroxide content of all samples was less than the maximum declared (2 milliequivalent peroxide/kg of lipid) by the National Iranian Standard Organization until the sixth month for dried products. Therefore, it can be concluded that the third month is the month of the beginning of changes in dried shrimp products. On the other hand, Wu and Mao [21] with study on dried grass carp (Ctenopharyngodon idellus) fillets found that the peroxide value was a poor indicator for heated samples. Also, they reported that use of the high temperature for drying process could speed up the breakdown of peroxides into carbonyl components, and thus the peroxide value may remain low. But their results were different from the results of this study on dried shrimp, because in this project the temperature was not higher than 70°C for drying samples. TVN is an indicator for the novelty detection in food products [27]. They include a wide range of volatile compounds, such as ammonia, methylamine, dimethylamine, trimethylamine and other similar compounds [28], and they are caused by the activity of enzymes, proteolytic bacteria and protein degradation [29]. The factors that create TVN in fish and shrimp meat are enzymes present in meat and microorganism activities [30]. Hence, its increase during the maintenance period can be attributed to the activity of bacteria causing corruption. The high activity In order to evaluate the lipid oxidation rate, the thiobarbituric acid index is used which shows the amount of secondary oxidation products, especially aldehydes [23]. The presence of such compounds causes changes in the sensory characteristics, including flavor and odor of products. In 2008, the National 13 J Fish Res 2018 Volume 2 Issue 1
Citation: Zaregashti Gh, Etemadian Y, Khanipour AA, Noghani F. The shelf-life of Macrobrachium nipponense dried meats during six months storage at room temperature. J Fish Res. 2018;2(1):7-16. parameters was statistically no significant and on redness and yellowness parameters was significant. The Chroma index and Hue angle with increase in the storage time decreased, which indicates a decline in initial quality over time. But Niamunuy et al. [9] did not see a significant difference in the color intensity and Hue angle when examining shrimp qualitative changes during boiling in a salt solution. Regarding the brown index, decrease in its content indicates the greater brown color. In this study, the results showed that the effect of time on the color change was significant and the dried shrimp by the cabinet-type air dryer showed the most brown color change in the heat. But there was no significant difference between dried shrimp in the oven and under vacuum dryers until the end of period. Niamnuy et al. [36] studies on changes in the color of dry shrimp during storage for 16 weeks at different temperatures (4, 15 and 25°C) reported that there is a good association between astaxanthin degradation and shrimp color variations. So keeping the dried shrimp in a vacuum package and at the low temperature will keep the pigment in them. Akonor et al. [20] with study on the physical properties of dried shrimps by conventional methods (the oven and solar dryers) observed that the amount of lightness and yellowness decreased and the redness increased per hour at the temperature approximately 55°C. of bacteria breaks down compounds such as trimethylamine oxide, peptides and amino acids into volatile species [31]. In general, the highest acceptable level of TVN in the shrimp meat has been suggested 25 mg N/100 g sample [32]. Another researcher has reported that the TVN of dried peeled shrimp at different packages (Styrofoam box, polythene bags and under bulk) during the sixth week were respectively, 27 ± 0.34, 16.8 ± 0.9 and 21 ± 0.98 mg N/100 g sample [33]. But in this study, the TVN of dried peeled shrimp in cabinet-type air, oven and under vacuum conditions along with vacuum packaging in metalize films after 6 months was respectively, 14.0 ± 0.57, 17.5 ± 0.35 and 19.0 ± 0.14 mg N/100 g sample. Therefore, the results of this study indicate that the use of metalized films is more suitable for maintaining the quality of shrimp meat. FFA is used as a quality index for aquatic organisms and other food products. It can be changed with the storage temperature, muscle type, species, fat content and season [16]. High levels of FFA during maintenance can result in increased oxidation and reduced quality. But in dry samples, low humidity greatly inhibits oxidation. For example, in this study, dried samples by cabinet-type air dryer, due to lower humidity, showed lower levels of FFA and oxidation. Another reason for the high level of fatty acids in the shrimp can be high cholesterol levels. In another study by Sampaio et al. [16] on fatty acids and the cholesterol oxidation in salted and dried shrimp, they reported that the presence of the high values of FFA and TBA in their samples indicates the degree of oxidation in the product, which was probably due to inadequate conditions of processing and storage. Sensory evaluation One of the pleasures of the life is eating a delicious food, which is not far from the reality. A delicious meal can destroy the fatigue of a hard day, and sometimes it is a great pleasure. In this regard, sensory evaluation is a scientific method in which the properties of food are reflected in a way that can be observed and measured. In this study, the dried shrimp in every three methods received the best score (5) for final acceptance in the first month by trained panel members and a score of 3 in the sixth month. Niamnuy et al. [9] with the sensory evaluation of Penaeus indicus dried shrimp, reported that using salt at 2% concentration at 120°C for 7 min received the best score for final acceptance by trained panel members. Color analysis Typically, the first qualitative feature of food is considered by the consumer is its appearance and color. Therefore, the color is one of the most important and apparent aspects of food, which affects consumers' acceptance. So that the colors caused by the growth of bacteria or the loss of food quality, will lose customer acceptance. On the other hand, many of the reactions that occur during the thermal process in food can affect their color. The term of color parameters are used to check the changes made to the color properties of the food substance during the drying process. These parameters include lightness or L* from black (0) to white (100) color, redness or a* from green (negative values) to red (positive values) color and yellowness or b* from blue (negative values) to green (positive values) color [34]. Other parameters derived from the above color parameters include the Chroma index (indicating the intensity of the color), the Hue angle (an indicator of the food color that is the angles of 0 or 360 degrees, representing the red and the angles 90, 180 and 270 degrees represents the yellow, green and blue colors, respectively) and the brown index (the product color changes to brown color) [35]. Changes in L*, a* and b* values occur due to the decomposition of pigments in food samples and can cause the increase in the amount of total color change, getting brown and eventually quality loss of the dry product. In this study, the increase in the lightness of samples was more in the dried shrimp by the oven and under vacuum dryers. Comparison of methods did not show any significant difference between the samples except in the sixth month. In general, the effect of time on lightness Counting of colonies Given that the product produced is completely dry due to removing its moisture, at the same rate, the number of microorganisms decreases. But over time, microorganisms will grow. Because the sample starts to absorb moisture. So the increase in the number of bacteria can be due to the increase in the shelf-life and gradual increase in humidity. Jayasinghe et al. [33] with studying the quality and shelf life of Penaeus indicus dry shrimp, reported that the number of microorganisms in dried shrimp meat and packed in polyethylene bags, Styrofoam and bulk packages were about 1.66 × 10⁵, 5.88 × 10⁴ and 3.33 × 10⁵, which was higher than the values observed in this study. Another study by Niamnuy et al. [9] found that with increasing boiling time and using more salt concentrations, the total number of microorganisms in the final product would be reduced. The chemical changes and the food spoilage by microorganisms have always been a great concern for the human. Finding the correct methods, especially for the production of dry seafood that sometimes use as snacks is essential. J Fish Res 2018 Volume 2 Issue 1 14
Zaregashti/Etemadian Conclusion 8. AOAC. Official methods of analysis. Washington DC, USA: Horowitz. 2005. In this study, with compare three selective methods of cabinet-type air, the oven and under vacuum dryers and then vacuum packaging of the samples in metalize films were observed that each method has its particular characteristics. For example, drying in the oven dryer had low cost but the moisture changes were high in it. It also took much time to dry the specimens. Drying under vacuum dryer, gave a beautiful orange color to the sample so that, it was quite effective in absorbing all panel members during sensory evaluation. However, after drying, the moisture content of samples dried by the vacuum dryer and packaged in metalizes films increased faster than samples dried by the cabinet-type air dryer. The chemical and microbial changes of samples dried by the vacuum dryer were also lower than oven-dried samples and more than samples dried by the cabinet-type air dryer. The cabinet-type air dryer compared with under vacuum dryer showed that despite the darker color, it has the least chemical and microbial changes. And that can guarantee the health of the community in the field of dry products. Therefore, the results of this study suggest the use of cabinet-type air dryer along with a vacuum packaging in metalize films for drying marine products such as shrimp. 9. Niamnuy C, Devahastin S, Soponronnarit S. Quality changes of shrimp during boiling in salt solution. J Food Sci. 2007;72:289-97. 10. Parvaneh V. Quality control and the chemical analysis. Tehran: University of Tehran Press. 2007. 11. USDA. United States Dept. of Agriculture. 2005. 12. Tarladgis BG, Watts BM, Younathan MT. A distillation method for the quantitative determination of malondialdehyde in rancid foods. J Am Oil Chem Soc. 1960;37:44-8. 13. Woyewoda AD, Shaw SJ, Ke PJ, et al. Recommended laboratory methods for assessment of fish quality. Nova Scotia: Halifax. 1986. 14. Meilgaard MC, Civille GV, Carr BT. Sensory evaluation techniques. (4th ed.). USA: CRC Press, Taylor and Francis Group. 2007. 15. ISIRI. Microbiology of food and animal feeding stuffs- Guideline of general requirements for examination. Institute of Standards and Industrial Research of Iran (ISIRI). 2007;9899. Acknowledgment The research team would like to grateful from Afshin Fahim, Fereshteh Khodabandeh, Masoomeh Rahnama, Soghra Kamali, Mojtaba Zareii, Azamat Dada Ghandi and Fereidoon Rafiepour for their cooperation in different parts of this project. The support provided by Inland Waters Aquaculture Research Center, Iranian Fisheries Science Research Institute, Agricultural Research, Education and Extension Organization (Bandar Anzali, Iran) is truly acknowledged. 16. Sampaio GR, Bastos DHM, Soares RAM, et al. Fatty acids and cholesterol oxidation in salted and dried shrimp. J Food Chem. 2006;95:344-51. 17. Armstrong SG, Leach DN, Wyllie SG. Nutritional evaluation of lipids in fish from temperature Australian waters. J Food Sci. 1991;56:1111-2. 18. Luzia LA, Sampaio GR, Castellucci CMN, et al. The influence of season on the lipid profiles of five commercially important species of Brazilian fish. J Food Chem. 2003;83:93-7. References 1. Li ZH, Wang JX, Xie S. Functions of environmental factors in shrimp aquaculture. Reserv Fish. 2004;24:1-4. 19. Moura AFP, Torres RP, Mancini-Filho J, et al. Caracterizacao da fracao lipidica de amostras comerciais de camarao-rosa. Archivos Latinoamericanos de Nutricion. 2002;52:207-11. 2. Ma K, Feng J, Lin J, et al. The complete mitochondrial genome of Macrobrachium nipponense. Gene. 2011;487:160-5. 20. Akonor PT, Ofori H, Dziedzoave NT, et al. Drying characteristics and physical and nutritional properties of shrimp meat as affected by different traditional drying techniques. Int J Food Sci. 2016;1:1-5. 3. Bandani GH, Khoshbavar Rostami H, Keymaram F, et al. The first report of shrimp Macrobrachiumnipponense Alagol, Almagol and Ajigol Lagoons Golestan province. Iran J Fish Sci. 2013;22:164-70. 21. Wu T, Mao L. Influences of hot air drying and microwave drying on nutritional and odorous properties of grass carp (Ctenopharyngodon idellus) fillets. J Food Chem. 2008;110:647-53. 4. De Grave S, Ghane A. The establishment of the Oriental River prawn, Macrobrachium nipponense (de Haan, 1849) in Anzali Lagoon, Iran. J Aquat Invasions. 2006;1:204-8. 5. Teeboonma U, Tiansuwan J, Soponronnarit S. Optimization of heat pump fruit dryers. J Food Eng. 2003;59:369-77. 22. Kamalakar D, Nageswara Rao L, Siva Prasada Rao K, et al. Studies on drying characteristics of prawn and fish. J Chem Biol Phys Sci. 2013;3:1972-82. 6. Namsanguan Y, Tia W, Devahastin S, et al. Drying kinetics and quality of shrimp undergoing. Drying Technol. 2004;22:759-78. 23. Gomes HA, Silva EN, Nascimento MRL, et al. Evaluation of the 2-thiobarbituric acid method for the measurement of lipid oxidation in mechanically deboned gamma irradiated chicken meat. J Food Chem. 2003;80(3):433-7. 7. Castro FAFD, Sant’Ana HMP, Campos FM, et al. Fatty acid composition of three freshwater fishes under different storage and cooking processes. J Food Chem. 2007;103:1080-90. 24. Greene BE, Cumuze TH. Relationship between TBA numbers and inexperienced panellists assessments of 15 J Fish Res 2018 Volume 2 Issue 1
Citation: Zaregashti Gh, Etemadian Y, Khanipour AA, Noghani F. The shelf-life of Macrobrachium nipponense dried meats during six months storage at room temperature. J Fish Res. 2018;2(1):7-16. 31. Lopez-Caballero ME, G´omez-Guill´en MC, P´erez-Mateos M, et al. A chitosan-gelatin blend as a coating for fish patties. J Food Hydrocolloids. 2004;19:303-11. oxidized flavor in cooked beef. J Food Sci. 1982;47:52- 54. 25. Kraemer FB. The anatomical micrology and the determinism of the fictitiousness of the amateurs of the camaraño-seco comercializados of the estuary of Rio de Janeiro. Dissertation of the University of the Federal Fluminense. 2000. 32. Gimenez B, Roncales P, Beltran JA. Modified atmosphere packaging of filleted rainbow trout. J Sci Food Agric. 2002;82:1154-9. 33. Jayasinghe PS, Jayasinghe JMPK, Galappaththi CP, et al. Influence of different processing methods on quality and shelf life of dried shrimp. Sri Lanka J Aquat Sci. 2006;11:85-91. 26. Huss HH. Quality and quality changes in fresh fish. In FAO fisheries Technical paper. FAO, Roma. 1995;334. 27. Rezaei M, Hosseini SF. Quality assessment of farmed rainbow trout (Oncorhynchus mykiss) during chilled storage. J Food Sci. 2008;73:93-6. 34. Prachayawarakorn S, Soponronnarit S, Wetchacama S, et al. Desorption isotherms and drying characteristics of shrimp in superheated steam and hot air. Drying Technol. 2002;20:669-84. 28. Fan W, Sun J, Chen Y, et al. Effect of chitosan coating on quality and shelf life of silver carp during frozen storage. J Food Chem. 2009;115:66-70. 35. Dadali G, Demirhan E, Özbek B. Color change kinetics of spinach undergoing microwave drying. J Drying Technol. 2007;25:1713-23. 29. Kilinc B, Cakli S. Determination of the shelf life of sardine (Sardina pilchardus) marinades in tomato sauce stored at 4°C. J Food Control. 2005;16:639-44. 36. Niamnuy C, Devahastin S, Soponronnarit S, Vijaya Raghavan GS. Kinetics of astaxanthin degradation and color changes of dried shrimp during storage. J Food Eng. 2008;87:591-600. 30. Razavi Shirzi H. Seafood technology, principles of handling and processing (1). Tehran: Pars Negar Press. 2007. *Correspondence to: Zarehghashti Gh Inland Waters Aquaculture Research Center Iranian Fisheries Science Research Institute Agricultural Research Education and Extension Organization (AREEO) Bandar Anzali Iran Tel: +98 13 44424052 Fax: +98 13 44423070 E-mail: ghashtighorban@gmail.com J Fish Res 2018 Volume 2 Issue 1 16