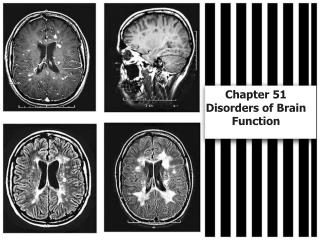
Brain Function Measures: Imaging and Blood Flow Correlation
Explore how various technologies like MRI, CT Scan, EEG, and PET assess brain structure and function, crucial for diagnosing brain diseases and injuries. Learn about advanced techniques like fMRI and Diffusion-Perfusion-weighted MRI.

Brain Function Measures: Imaging and Blood Flow Correlation
E N D
Presentation Transcript
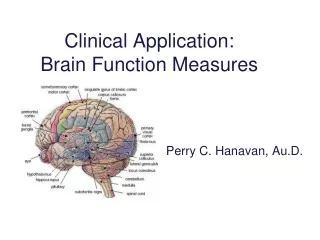
Clinical Application:Brain Function Measures Perry C. Hanavan, Au.D.
Question Which shows imaging plus blood flow assesses correlates function with structure? • EEG • PET • MRI • Ct Scan • MEG
Brain Structure Vs. Function • Imaging technologies assess structure • MRI • Ct Scan • Electrophysiologic technologies assess function • EEG • EP • auditory, visual, tactile, vestibular • Imaging plus blood flow assesses correlates function with structure • SPECT • IB-PET & lorbetapir -F18 PET • PET • fMRI • Imaging (MRI) plus EEG • Magnetoencephalography (MEG)
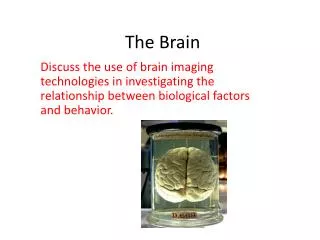
Computerized TomographyCt Scan • x-ray technology • sensitive to tissue densities • relatively quick procedure • detects calcification, hemorrhages, tumors, cerebrovascular disease, head trauma, cerebral atrophy • potential health risk due to x-ray
Magnetic Resonance Imaging • MRI technology able to assess differences in water and hydrogen atom distribution in various tissues combined with radio frequency signals • no radiation • easily detects fine differences between soft tissues such as grey and white matter, cerebrospinal fluid, vascular structures • detects plaque occurring with MS • clearly identifies cranial nerves and subcortical structures • diagnosis various brain diseases and disorders • imaging times longer than CT, thus more costly • Metal devices prevent MRI such as CI, clips, pacemakers
Diffusion-tensor MRI (DTMRI) Used to visualize white matter tracts connecting different parts of neural networks in the brain Used in pre-surgical planning for removal of a brain tumor to ensure tracts are spared during surgery. Used to the study of 14 neurological conditions such ADHD and other developmental disorders, thought to arise from problems in white matter connections
Diffusion-weighted (DWMRI) Shows whether brain tissue damage due to insufficient blood flow to the tissue Can visualize tissue within minutes after damage by an “ischemic” injury (such as a stroke-producing blood clot) Thus, allows early identification of damage
Perfusion-weighted MRI Show areas of brain blood flow has been altered based on time course of regional signal changes induced by exogenously administered MRI contrast agent
Diffusion-Perfusion-weighted MRI Used together to estimate “ischemic penumbra,” tissue damaged from reduced blood flow but not yet dead. This tissue is target of intensive therapy for patients who have had ischemic stroke • Brain or pituitary gland tumor • Pituitary disease • Brainstem or cerebellum abnormalities • Multiple sclerosis
Magnetic Resonance Spectroscopy MRS provides biochemical information about tissues of body (without the need for a biopsy) MRI gives structure informationof the body Whereas MRI shows tumour (cancer) location, MRS, in theory, tells aggressiveness of (malignant) tumour
EEG • Electroencephalography measures and records the electrical activity of the brain from multiple scalp electrodes. • Special sensors (electrodes) are attached to the scalp and connected to a computer to record and store the electrical activity of the brain.
Quantitative Electroencephalography (qEEG) • The digital EEG data is statistically analyzed, sometimes comparing values with “normative” database reference values and is converted into color maps or “Brain maps”. • Measure of various aspects of cognitive function • qEEG (quantitative) • qEEG • qEEG • qEEG
Evoked Potentials • Measure event related activity • visual • auditory • tactile • Auditory Evoked Potentials • ABR, middle, slow, late • Mismatch negativity (MMG) • odd ball paradigm
Auditory Evoked Potentials Auditory evoked potential analyzed on logarithmic time-base to reveal the component potentials with approximately equal weighting and categorized in arbitrary but commonly used time windows of short- (SLR), middle- (MLR), and long- (LLR) latency responses. (Figure modified and redrawn from Michelini et al., 1982.)
fMRI • hemodynamic response • increase in blood flow to region is related to amount of neural activity in region of the brain • indirect measure of brain function • assess cognitive function • safe noninvasive technology • assess brain function over time • assess effects of brain damage • assess recovery from damage • Intro to fMRI
fMRI Shows brain in action Elucidate processes involved in higher cognitive functioning Highly sensitive - can detect small changes Method of choice for identifying areas of brain activated with specific cognitive or motor task. Indirect measure as dynamic changes in blood flow is much longer than neurons to fire electrochemical messages. Used to study the reorganization of function following injury to a single brain area.
Positron Emission Tomography • Uses radioactive tracer combining with human chemical element (oxygen, nitrogen, etc.) to measure hemodynamic response • Disintegration of radioactive tracer emits positrons (positively charge particles) which collide with electrons producing gamma rays that are detected and measured by computers • PET scans displayed in 3D with various colors representative of hemodynamic response
Positron emission tomography (PET) Radiation or nuclear medicine imaging Produces 3-dimensional color images of functional processes Detects pairs of gamma rays emitted indirectly by a tracer (positron-emitting radionuclide) placed in body on biologically active molecule. Images are reconstructed by computer analysis.
PIB-PET & lorbetapir -F18 PET PIB-PET (Pittsburgh Compound B”) and “florbetapir -F18 PET” • Tracers developed that bind solely to beta amyloid proteins • These proteins accumulate in the brains of people with • presymptomatic mild cognitive impairment (MCI), • overt MCI, and Alzheimer’s disease, • Not in the brains of cognitively healthy adults
Single Photon Emission Computed Tomography • SPECT scan is a type of nuclear imaging test that shows how blood flows to tissues and organs through arteries and veins in the brain • Integrates two technologies: computed tomography (CT) and a radioactive material (tracer). • gamma photon–emitting radionuclides are administered and then detected by one or more gamma cameras
Uses in Communication Disorders • ADD • ADHD • Alzheimer’s • Arteriovenous Malformation • Auditory processing • Developmental Delays • EpilepsyEpilepsy • Hearing assessment • MSMS • Parkinson’s • Stroke • Stuttering • Vestibular • TBI