Mastering Absolute Value and Inequalities in Mathematics
This educational resource focuses on solving absolute value equations and inequalities, as well as linear inequalities and compound inequalities. Students will practice mathematical concepts and learn to apply the rules, including the importance of switching the direction of inequalities when multiplying or dividing by a negative number. There are also exercises on analyzing data sets with measures of central tendency including mean, median, and mode, and using stem-and-leaf plots. Engage with various entry tasks and homework assignments to reinforce learning.

Mastering Absolute Value and Inequalities in Mathematics
E N D
Presentation Transcript
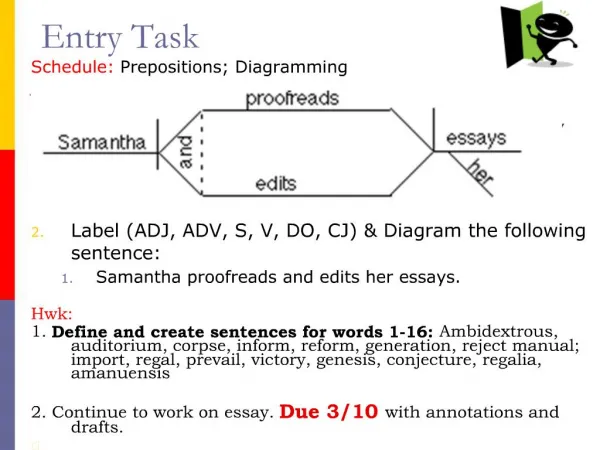
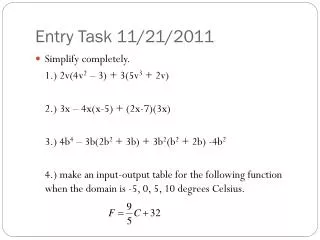
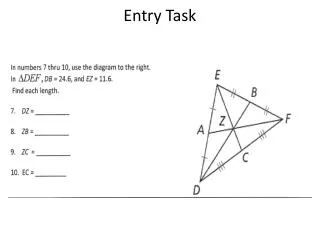
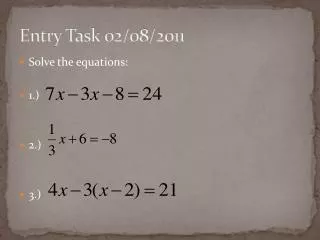
Entry Task 02/08/2011 • Solve the equations: • 1.) • 2.) • 3.)
Objective • Solve absolute value equations
Copy the following into your math journal, keep copying it over again till I say stop -If c is negative then there are no solutions, since an absolute value cannot be negative.
Vocabulary Inequality- two expressions with an inequality symbol between them. Solution to an inequality - a number that produces a true statement when it is substituted for the variable in the inequality.
Section 6.2 solving inequalities If you multiply or divide by a negative number then you have to switch the direction of the inequality
Home Fun • Solving linear inequalities worksheet, due on Monday, front and back.
Entry Task 02/09/2011 • Solve the inequalities: • 1.) • 2.) • 3.)
Entry Task 02/10/2011 • Complete problems 1-6 on 6.2 standardized test practice. You have 12 minutes. • If you finish early work on 6.2 B
Entry Task 02/11/2011 You want to go to the state fair and try your luck playing the games on the midway. The entrance fee is $5 and the games are each $1.50. Write an inequality that represents the possible number of games you can play if you have $25. Solve the inequality. What is the maximum number of games you can play?
Section 6.3 • Objective: Write, solve, and graph compound inequalities.
Solving Compound inequalities • A Compound inequality consists of two inequalities connected by a and or an or. • Examples: • a.) All real numbers that are greater than zero and less than or equal to 4. • Or and
Examples cont. • B.) All real numbers that are less than negative one or greater than 2. • or
Entry Task 02/14/2011 • Which values of x make the following true? • 1.) 2.) • Solve. • 3.) • 4.)
Section 6.4 • Objective: Solve absolute value equations. Solve absolute value inequalities.
Entry Task 02/15/2011 • Which values of x make the following true? • 1.) 2.) • Solve. • 3.) • 4.)
Entry Task 02/16/2011 • Solve. • 1.) 2.)
Entry Task 02/17/2011 • Get out 6.4 so I can check it for group points. • Complete problems 1-6 on the 6.4 Standardized test practice. You have 12 minutes
Entry Task 11/07/2011 • Find the mean, median and mode of the following set of data, 0 69 68 60 23 0 0 76 0 0 73 0 81 0 48 18 0 89 0 0 75 75 Now get rid of the zeros and do the same thing. What has changed? If I told you these were your test scores, why might I leave out the zeroes when I calculate the mean median and mode?
Entry Task 11/07/2011 • Distribute and then combine like terms. • 1.) 3(2x-1) 2.) 2a-3(4-a) • 3.) 4y(2y+3)-8y2 +1 4.) 4v3 – 3v2(2v+1)+ 2v2 • Find the area of a rectangle whose length is 2x and whose width is 3x-1
Algebra 1 Chapter 6 PLEs for 6.6 and 6.7 A1.2.D: Determine whether approximations or exact values of real numbers are appropriate, depending on the context, and justify the selection A1.6.A: Use and evaluate the accuracy of summary statistics to describe and compare data sets. A1.6.B: make valid inferences and draw conclusions based on data.
Section 6.6 • Objective: Make and use a stem-and-leaf plot to put data in order. Find the mean, median and mode of data.
Stem and leaf plot • A stem and leaf plot organizes data based on digits. • Make a stem and leaf plot for the following set of data. 45 1 52 42 10 40 50 40 7 46 19 35 3 11 31 6 41 12 43 37 8 41 48 42 55 30 58 Work problem 11 on homework
Measures of central tendency • Mean, median and mode are all measures of central tendency, they are numbers that tell us something about a set of data • The mean of n numbers is the sum of the numbers divided by n • The median of n numbers is the middle number when they are arranged in order, if n is even, the median is the mean of the two middle numbers • The mode of n numbers is the number that occurs most frequently, there may be more than one or no mode.
Measures of central tendency • Make and stem and leaf pot and then find the mean, median and mode of the following data set. Which measure of central tendency is most representative of the data? • 45 1 52 42 10 40 50 40 7 46 19 35 3 11 31 6 41 12 43 37 8 41 48 42 55 30 58
What if…? • If I add the number 100 to the previous data set, what would happen to my mean? • The mode? • The median?
Entry Task 11/08/2010 • Determine if the following relationship is a function. • What is the solution to a.) 7 b.) 31/3 c.) -7 d) 21 What is the solution to a.) -6/23 b.) no solution c.) 0 d.) 23 • Simplify: • 1.) 3(x-4) 2.) 4-2(1-x)+3x 3.) 2b(b-4)-2b +1
Section 6.7 • Objective: Draw a box-and-whisker plot to organize real-life data. Read and interpret a box-and-whisker plot.
Box-and-Whisker Plots • A Box-and-Whisker plot divides data into four parts. • The data is first divided in half by the median, which is also called the second quartile. • Then you take the median of the lower half of the data, this is called the first quartile. • Next you take the median of the upper part of the data, this is called the third quartile. Make a box and whisker plot of the following numbers 11 19 5 34 9 25 16 17 11 12 7
Example • 11 19 5 34 9 25 16 17 11 12 7
Entry Task 11/10/2010 1.) The following data are temperatures for the month of December. First make a stem and leaf plot and then use the stem and leaf plot to make a box and whisker plot. What part of the box and whisker plot represents the top half of the data? 40 8 12 33 26 21 30 31 0 32 35 19 15 2.) Find the mean and mode of the above data. What measure of central tendency best represents the temperature in December? simplify 3.) 4.)
Fitting a line to data • Best-fit line- A line that represents a collection of data, even if you can’t draw a line through all of the points • Sometimes there is no line of best fit
Correlation • Positive correlation- When one increases, so does the other • Negative correlation- when one increases, the other decreases • No correlation- when there is no good line of best fit
Does the data have a positive or negative correlation? Mr. Shapiro found that the amount of time his students spent doing mathematics homework is positively correlated with test grades in his class. He concluded that doing homework makes students’ test scores higher. Is this conclusion justified? Explain any flaws in Mr. Shapiro’s reasoning.
Correlation • A graph comparing the age in months of a group of high scholars to their height in inches is to the right. • Is there a positive correlation between height and age • Would you say that this data proves that being older makes you taller? Why? • If not, what would we need to do to prove it? Age (months)
Homework • Pg. 378 #1-10
Entry Task 11/10/2010 • For the following data first make a stem and leaf plot and then use the stem and leaf plot to make a box and whisker plot. What part of the box and whisker plot represents the top half of the data? 40 8 12 33 26 21 Solve:
Entry Task 11/15/2010 • For the following data first make a stem and leaf plot and then use the stem and leaf plot to make a box and whisker plot. What part of the box and whisker plot represents the top half of the data? 10 8 9 2 3 2 1 4 5 Solve:
Review Assignment • Pg. 381 quiz 3 #1-9 • Due at end of period