NGS data analyses with BioUML
NGS data analyses with BioUML. Fedor Kolpakov Biosoft.Ru, Ltd. Institute of Systems Biology, Ltd. Novosibirsk, Russia. Agenda. BioUML overview NGS tools quality control alignment tools annotation tools workflows Genome browser Archakov’s genome Ribosome profiling Live demonstration.

NGS data analyses with BioUML
E N D
Presentation Transcript
NGS data analyseswith BioUML Fedor Kolpakov Biosoft.Ru, Ltd. Institute of Systems Biology, Ltd.Novosibirsk, Russia
Agenda • BioUML overview • NGS tools • quality control • alignment tools • annotation tools • workflows • Genome browser • Archakov’s genome • Ribosome profiling • Live demonstration
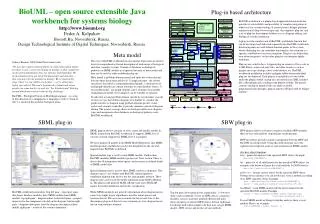
BioUML platform BioUML is an open source integrated platform for systems biology that spans the comprehensive range of capabilities including access to databases with experimental data, tools for formalized description, visual modeling and analyses of complex biological systems. Due to scripts (R, JavaScript) and workflow support it provides powerful possibilities for analyses of high-throughput data. Plug-in based architecture (Eclipse run time from IBM is used) allows to add new functionality using plug-ins. BioUML platform consists from 3 parts: BioUML server – provides access to biological databases; BioUML workbench – standalone application. BioUML web edition – web interface based on AJAX technology;
Main platforms for bioinformatics and BioUML Taverna R/Bioconductor scripts, statistics, plots standalone application powerful workflows standalone applicationpowerful workflows scripts, statistics, plots BioUML platform Eclipse plug-in based architecture, chemoinformatics web interface, collaborative research genome browser Eclipse plug-in based architecture, chemoinformatics workflows, web interface, collaborative research, genome browser Galaxy BioClipse
Main platforms for bioinformatics and BioUML Taverna R/Bioconductor scripts, statistics, plots standalone application powerful workflows • + systems biology • visual modelling • simulation • parameters fitting • … • + chat for on-line consultations standalone applicationpowerful workflows scripts, statistics, plots BioUML platform Eclipse plug-in based architecture, chemoinformatics web interface, collaborative research genome browser Eclipse plug-in based architecture, chemoinformatics workflows, web interface, collaborative research, genome browser Galaxy BioClipse
Market Android market AppStore Biostore Android MacOS,iPOD, iPhone Platform BioUML
BioUML ecosystem Developers- plug-ins: methods, visualization, etc. - databases Users- subscriptions- collaborative & reproducible research • Experts • services for data analysis • on-line consultations provide toolsand databases use provide services Biostore BioUMLplatform
NGS • интегрированные в BioUML методы (Bowtie, MACS, ChIPHorde, ChIPMunk, …) • программы, интегрированные в Galaxy • пакеты R • аннотация найденных пиков (SNP, сайтов и т.п.) • визуализация • workflows • ChIP-SEQ • RNA-SEQ • сборка и аннотация генома человека (в процессе) • поддержка распарелеливания внешних программ как часть workflow • база данных GTRD (на основе данных ChIP-SEQ) • выделенные сервера • Amazon EC2 – по запросу • Biodatomics – 64 ядра, 256 Гб памяти.
Preprocess raw reads Remove reads not satisfying simple quality tests, removes adapters, trims low quality bases from read ends Track statistics Gather various statistics about track or FASTQ file Raw data preprocessing
Bowtie fast no indels used for chip-seq выравнивание коротких ридов: Novoalign -single-end and paired-end - in nucleotide and color space - handle indels, - finds global optimum alignments using full Needleman-Wunsch algorithm
Bowtie for alignment MACS for peak calling ChipMunk, IPS, MEME for motif discovery ChIP-seq
Popular NGS toolboxes available: GATK, Picard, SAM tools
NGS data quality control2 examples: rna-seq data (rat, IPS )genome data – Archakov’s genome
Track statistics (FastQC) • Estimate quality of RAW or aligned reads like in FastQC program http://www.bioinformatics.babraham.ac.uk/projects/fastqc/ • All original FastQC processors are supported • Works faster than FastQC • Additional processor: Overrepresented prefixes • Overrepresented K-mers works more precise (do not skip 80% of sequences) • Along with HTML report separate statistics tables are generated and accessible for further analysis • Ability to merge several reports into composite report • As any BioUML analysis can become a part of workflow, scripts, etc. • Tested on Archakov AP3 (RAW reads: 5.9Gb csfasta+12.7Gb qual),analysis time: 36 min (all processors) • Tested on Zakian db50 (RAW reads: 6.5Gb fastq),analysis time: 7 min (all processors)
Track statistics launch Input data: BAM, FastQ and Solid (colorspace) data supported Whether reads should be aligned by left or right side Switch off individual processors to save time.
Track statistics results (Archakov AP3): Quality per sequence
Track statistics results (Archakov AP3): Nucleotide content per base
Track statistics results (Archakov AP3): GC content per base
Track statistics results (Archakov AP3): GC content per sequence
Track statistics results (Archakov AP3): Duplicate sequences
Track statistics results (Archakov AP3): Overrepresented sequences and 5-mers
Track statistics results (Archakov AP3): Overrepresented prefixes
Track statistics results (Zakian db50): Quality per sequence
Track statistics results (Zakian db50): Nucleotide content per base
Track statistics results (Zakian db50): GC content per sequence
Track statistics results (Zakian db50): Overrepresented sequences and 5-mers
Genome browser:main features • uses AJAX and HTML5 <canvas> technologies • interactive - dragging, semantic zoom • tracks support • Ensembl • DAS-servers • user-loaded BED/GFF/Wiggle files
DAS The Distributed Annotation System (DAS) defines a communication protocol used to exchange annotations on genomic or protein sequences. It is motivated by the idea that such annotations should not be provided by single centralized databases, but should instead be spread over multiple sites. Data distribution, performed by DAS servers, is separated from visualization, which is done by DAS clients. DAS is a client-server system in which a single client integrates information from multiple servers. It allows a single machine to gather up sequence annotation information from multiple distant web sites, collate the information, and display it to the user in a single view. DAS is heavily used in the genome bioinformatics community. Over the last years we have also seen growing acceptance in the protein sequence and structure communities.
Genome browser Two BAM tracks are compared with each other (Example view on Human NCBI37 Chr.1) Profile is visible showing the coverage
Genome browser Upon zooming individual reads become visible. All information associated with selected read is displayed in the Info box
Genome browser In detailed scale phred qualities graph is displayed along with changed nucleotides between read and reference sequence