Exploring BioUML Workbench: Concepts and Applications in Systems Biology
Join us for a comprehensive overview of the BioUML workbench, presented by the Laboratory of Bioinformatics at the Design Technological Institute of Digital Techniques in Novosibirsk, Russia. This session will cover the latest versions from 0.8.0 to 0.8.3, demonstrating features such as visual modeling, automated code generation for simulations, and integration of biological databases. Engage with live demonstrations, learn about new concepts, and contribute to discussions on the future of BioUML. Perfect for researchers and developers in the field of Systems Biology.

Exploring BioUML Workbench: Concepts and Applications in Systems Biology
E N D
Presentation Transcript
BioUML Fedor Kolpakov Institute of Systems Biology(spin-off of DevelopmentOnTheEdge.com)Laboratory of Bioinformatics,Design Technological Institute of Digital TechniquesNovosibirsk, Russia
Agenda • Part 1: overview of BioUML workbench • Cafe break • Part 2: new concepts and possibilities(versions 0.8.0 – 0.8.3) • Further development • Questions and discussion
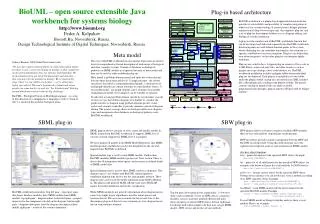
Part 1: overview of BioUML workbench • Live demonstration: • Installation of BioUML workbench • Creating and simulating simple model • SBML - Biomodels module • BioPAX import • BMOND database web interface • JavaScript shell Overview • Main concepts • Meta model • Architecture overview • Diagram types • Database module concepts • Full text search • Graph search • Simulation engine • BioUML server • BMOND/Biopath database
Part 2: new concepts and possibilities • Live demonstration • Loading database modules from server • Text search • Graph search • Creating of composite database module • Creating of composite diagram • Experiment • Graphic notation editor • Microarray data analysis Overview • Reconstruction as solitaire game • Levels of biological information • BioHub concept • Composite database module • Composite diagram • Experiment concept • Graphic notation editor • Microarray data analysis
Useful resources http://www.biouml.org/demo Flash movies that demonstrates how to work with BioUML workbench http://www.biouml.org/user/help/index.html http://www.biouml.org/download/0.7.8/manual.doc Useguide, >200 pages • HTML version • MS Word document http://bmond.biouml.org Examples of pathway annotation: BMOND – Biological Models aNd Diagrams database
Main BioUML concepts and ideas • Visual modeling • Meta model – problem domain neutral level of abstraction that describes system as compartmentalized graph • Diagram type concept – formally defines graphical notation and provides its incorporation into BioUML workbench. • Automated code generation for model simulation. • Database module concept - allows developer to incorporate databases on biological pathways into BioUML workbench taking into account database peculiarities. • Plug-in based architecture (Eclipse platform runtime from IBM company).
Biological databases Data search and retrieving Formal description of structure of biological system Visual modeling Automated code generation for model simulation of model behavior MATLAB code … code Java code Simulating using MATLAB. JMatLink allows to BioUML workbench to start MATLAB and retrieve simulations results Java simulation plug-in. Contains ODE solvers ported from odeToJava and methods for hybrid models support.
Example: system from two chemical reactions - k1[A] - k2[B] k1[A] K2[B] A B C R1 R2 100 0 0 k1 - reaction rate for R1 k2 – reaction rate for R2 Corresponding mathematical model:
Meta-model: example of formal description of system from two chemical reactions - k1[A] - k2[B] k1[A] k2[B] A B C R1 R2 100 0 0 Description of system ID R1 ID B ID R2 ID C ID A A - >B CC .. B - >C CC .. CC .. components in the ... ... ... ... ... database // // // // // System structure is R1 R2 described as a graph C A B Mathematical model 0 - k2[B] k2[B] k1[A] 100 - k1[A] 0 of the system
Suggested approach can be applied for modeling biological systems using: • Systems of ordinary differential equations • Systems of algebra-differential equations • State and transition diagrams • Hybrid models • Boolean and logical networks • Petri nets • Markov chains • Stochastic models • Cellular automates • … Some limitations • Spatial models • PDE • …
Plug-in based architecture A plug-in is the smallest unit of BioUML workbench function that can be developed and delivered separately into BioUML workbench. A plug-in is described in an XML manifest file, called plugin.xml. The parsed contents of plug-in manifest files are made available programmatically through a plug-in registry API provided by Eclipse runtime. - extension points are well-defined function points in the system where other plug-ins can contribute functionality. - extension is a specific contribution to an extension point. Plug-ins can define their own extension points, so that other plug-ins can integrate tightly with them. • Plug-in • plugin.xml • Java jar files • Plug-in • plugin.xml • Java jar files • Plug-in • plugin.xml • etc. Eclipse platform runtime
Formal description and modeling of biological systems require coordinated efforts of different group of researchers: • programmers - they should provide computer tools for this task. • problem domain experts - they should specify what and how should be described. • experimenters and annotators - they should describe corresponding data following to these rules. • mathematicians - they should provide methods for models analysis and simulations. BioUML architecture separates these tasks so they can be effectively solved by corresponding group of researchers and provides simple contract how these groups and corresponding software parts should communicate.
Diagram type concept Diagram type defines: · types of biological components and their interactions that can be shown on the diagram; · diagram view builder - it is used to generate view for each diagram element taking into account problem domain peculiarities; · semantic controller - provides semantic integrity of the diagram during its editing; · filters – hide or highlight diagram elements according to some selection criteria.
Reconstruction and formal description of biological systems using different diagram types Formality, details Semi-structureddata 1. Semantic network 2. Pathway diagram(semantic network + gene network or metabolic pathway) Structured data(reactions and its components) 4. Gene network 3. Metabolic pathway Kinetic data(kinetic laws, constants, initial values 5. Pathway simulation (mathematical model)
Cell cycle model of mammalian G1/S transition control with E2F feedback loops(pathway simulation diagram)
NF-kB dynamics in nucleus and cytoplasm before and after TNF-alpha stimulation (Hoffmann et al., 2002)
Regulation of caspase-3 activation and degradation (Stucki and Simon, 2005 )
Database module concept The database module concept allows to developer define new diagram types and incorporate other databases on biological pathways into BioUML framework. The database module defines mapping of database content into diagram elements and diagram types that can be used with the database. Module also provides query engine that can be used by BioUML workbench to find interactiong components of the system.
BioUML database modules • BioUML standard module • Databases • EBI databases: Ensembl, UniProt, ChEBI, GeneOntology • Biopath/BMOND (http://biopath.biouml.org) • KEGG/Ligand (http://www.kegg.com) • TRANSPATH (http://www.biobase.de) • GeneNet (http://wwwmgs.bionet.nsc.ru) • Formats • SBML – Systems Biology Markup Language, level 1, 2 (http:// www.sbml.org) • CellML – Cell Markup Language (http://www.cellml.org) • BioPax – Biological Pathways Exchange (http://www.biopax.org) • PSI-MI • OBO • GXL - Graph eXchange Language (http://www.gupro.de/GXL)
User interface for full text search: 1) pop-up menu; 2) menu buttons for selected entity; 3) full text search pane.
Biological databases Data search and retrieving Formal description of structure of biological system Visual modeling Automated code generation for model simulation of model behavior MATLAB code … code Java code Simulating using MATLAB. JMatLink allows to BioUML workbench to start MATLAB and retrieve simulations results Java simulation plug-in. Contains ODE solvers ported from odeToJava and methods for hybrid models support.
%script for 'CellCycle_1991Gol' model simulation %constants declaration global Reaction1_vi Reaction2_kd Reaction4_K1 Reaction4_Kc Reaction4_VM1 Reaction5_K3 Reaction5_VM3 Reaction6_K2 Reaction6_V2 Reaction7_K4 Reaction7_V4 Reaction1_vi = 0.023 Reaction2_kd = 0.00333 Reaction4_K1 = 0.1 Reaction4_Kc = 0.3 Reaction4_VM1 = 0.5 Reaction5_K3 = 0.1 Reaction5_VM3 = 0.2 Reaction6_K2 = 0.1 Reaction6_V2 = 0.167 Reaction7_K4 = 0.1 Reaction7_V4 = 0.1 %Model rate variables and their initial values y = [] y(1) = 0.0 % y(1) - $cytoplasm.C y(2) = 0.0 % y(2) - $cytoplasm.EmptySet y(3) = 0.0 % y(3) - $cytoplasm.M y(4) = 0.0 % y(4) - $cytoplasm.X %numeric equation solving [t,y] = ode23('CellCycle_1991Gol_dy',[0 100],y) %plot the solver output plot(t,y(:,1),'-',t,y(:,2),'-',t,y(:,3),'-',t,y(:,4),'-') title ('Solving Goldbeter problem') ylabel ('y(t)') xlabel ('x(t)') legend('$cytoplasm.C','$cytoplasm.EmptySet','$cytoplasm.M','$cytoplasm.X');
Function to calculate dy/dt for the model function dy = CellCycle_1991Gol_dy(t, y) % Calculates dy/dt for 'CellCycle_1991Gol' model. %constants declaration global Reaction1_vi Reaction2_kd Reaction4_K1 Reaction4_Kc Reaction4_VM1 Reaction5_K3 Reaction5_VM3 Reaction6_K2 Reaction6_V2 Reaction7_K4 Reaction7_V4 % write rules to calculate some eqution parameters rateOfReaction1 = Reaction1_vi; rateOfReaction4 = ((1 - y(3))*Reaction4_VM1*y(1))/((1 + Reaction4_K1 - y(3))*(Reaction4_Kc + y(1))); rateOfReaction5 = (Reaction5_VM3*(1 - y(4))*y(3))/(1 + Reaction5_K3 - y(4)); rateOfReaction6 = (y(3)*Reaction6_V2)/(Reaction6_K2 + y(3)); rateOfReaction7 = (Reaction7_V4*y(4))/(Reaction7_K4 + y(4)); rateOfReaction2 = y(1)*Reaction2_kd; % calculates dy/dt for 'CellCycle-1991Gol.xml' model dy = [ + rateOfReaction1 - rateOfReaction2 - rateOfReaction1 - rateOfReaction4 - rateOfReaction5 + rateOfReaction6 + rateOfReaction7 + rateOfReaction2 + rateOfReaction4 - rateOfReaction6 + rateOfReaction5 - rateOfReaction7]