Download
1 / 85
1.1k likes | 1.57k Vues
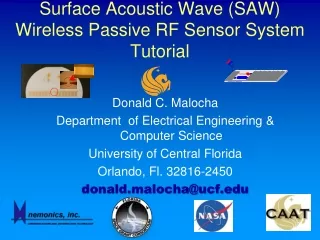
Surface Acoustic Wave (SAW) Wireless Passive RF Sensor System Tutorial. Donald C. Malocha Department of Electrical Engineering & Computer Science University of Central Florida Orlando, Fl. 32816-2450 donald.malocha@ucf.edu. Don Malocha University of Central Florida.

E N D
Surface Acoustic Wave (SAW) Wireless Passive RF Sensor System Tutorial Donald C. Malocha Department of Electrical Engineering & Computer Science University of Central Florida Orlando, Fl. 32816-2450 donald.malocha@ucf.edu
Don MalochaUniversity of Central Florida • Don Malocha, Professor, University of Central Florida • BS, MS and PhD, Univ. of Illinois, UIUC • Texas Instruments, Corporate Research Laboratory, Dallas, MTS • Sawtek, Orlando, Mgr. of Advanced Product Development • Motorola, Visiting/Member of the Technical Staff, Phoenix and Ft. Lauderdale • Visiting Faculty, ETH, Switzerland, and Univ. of Linz, Austria • Past President, IEEE Ultrasonics, Ferroelectrics and Frequency Control Society • WEB site: http://caat.engr.ucf.edu/ UCF – nations 2nd largest university
Acknowledgment • The author wishes to thank continuing support from everyone who has aided us at NASA, and especially Dr. Robert Youngquist, NASA-KSC. • The foundation of this work was funded through NASA Graduate Student Research Program Fellowships, the University of Central Florida – Florida Space Grant Consortium, and NASA STTR and SBIR contracts. • Continuing research is funded through NASA STTR/SBIR contracts and industrial collaboration with our industrial partner • Mnemonics Inc. (MNI), Melbourne, Fl.
Multi-Sensor TAG Approaches • Silicon RFID – integrated or external sensors • Requires battery, energy scavenging, or transmit power • Radiation sensitive • Limited operating temperature & environments • SAW RFID Tags - integrated or external sensors • Passive – powered by interrogation signal • Radiation hard • Operational temperatures ~ 0 - 500+ K • Resonator – coding in frequency • CDMA- time coding, 40-60 dB loss, wideband • OFC - time & frequency coding, 6-20 dB loss, ultra wide band
Why Use SAW Sensors and Tags? • Frequency/time are measured with greatest accuracy compared to any other physical measurement (10-10 - 10-14). • External stimuli affects device parameters (frequency, phase, amplitude, delay) • Operate from cryogenic to >1000oC • Ability to both measure a stimuli and to wirelessly, passively transmit information • Frequency range (practical) ~100 MHz – 3 GHz • Monolithic structure fabricated with current IC photolithography techniques, small, rugged
What is a typical SAW Device? • A solid state device • Converts electrical energy into a mechanical wave on a single crystal substrate • Provides very complex signal processing in a very small volume • Approximately 4-5 billion SAW devices are produced each year • Applications: • Cellular phones and TV (largest market) • Military (Radar, filters, advanced systems • Currently emerging – sensors, RFID
SAW Principle - Piezoelectricity Squeezing a piezo-crystal creates a voltage. A voltage can compress or dilate a piezo-crystal.
SAW BasicsTransduction & Reflection fro SAW Sensors SAW - mechanical wave trapped to the surface Transduction via piezoelectric effect Velocity ~ 3000 - 4000 m/sec Wavelength @ 1 GHz ~ 3 um Line resolution at 1 GHz ~ .75 um Reflection via Bragg reflector structure DC Effect RF to SAW Bragg reflector
SAW Materials to Meet Sensor Needs SAW travels ~ 105 slower than EM wave SAW wavelength @ 1 GHz ~ 3 um
SAW/IC Fabrication Techniques Lines are ~ .8 um SAW Transducer SAW reflector gratings The dark line in each micrograph is a 23 um gold wire SAW reflector gratings • SAW devices @ 1 GHz require submicron lithography. • Standard IC thin films, photolithography and processing are used.
Basic Passive Wireless SAW System Sensor #1 Gas Sensor #3 Temperature Sensor #2 Pressure • Goals: • Interrogation distance: 1 – 50 meters • # of devices: 10’s – 100’s - coded and distinguishable at TxRx • Aerospace applications – rad hard, wide temp., solid state, etc. • Single platform and TxRx for differing sensor combinations
RFID Sensor Two primary system functions: RFID and extraction of the measurand. The RFID must first be acquired and then the measurand extracted. The presentation will address these issues for a temperature sensor system. • RFID Acquisition • Priority for system • Coding approach • Demodulation approach • System Parameters • Measurand Extraction • RFID is acquired • S/N ratio • Accuracy • Acquisition rate
Diversity for Identification • Frequency Spectrum Diversity per Device • Coding • Divide into frequency bands • Time Delay per Device • Different offset delays per device • Pulse position modulation • Time allocations minimize code collisions • Spatial Diversity – device placement • Sensor & Tx-Rx Antenna Polarization • Use combinations of all to optimize system
Brief Introduction to Wireless SAW Sensors • One port devices return the altered interrogation signal • Range depends on embodiment • Range increased using coherent integration of multiple responses • Interrogator used to excite devices • Several embodiments are shown next
Reflective Delay Line Sensor “Wireless Interrogator System for SAW-Identification-Marks and SAW-Sensor Components”, F. Schmidt, et al, 1996 IEEE International Frequency Control Symposium • First two reflectors define operating temperature range of the sensor • Time difference between first and last echoes used to increase resolution of sensor • No coding as shown
SAW Chirp Sensor “Spread Spectrum Techniques for Wirelessly Interrogable Passive SAW Sensors”, A. Pohl, et al, 1996 IEEE Symposium on Spread Spectrum Techniques and Applications • Increased sensitivity when compared with simple reflective delay line sensor • Multi-sensor operation not possible due to lack of coding
Impedance SAW Sensors “State of the Art in Wireless Sensing with Surface Acoustic Waves”, W. Bulst, et al, IEEE UFFC Transactions, April 2001 • External classical sensor or switch connected to second IDT which operates as variable reflector • Load impedance causes SAW reflection variations in magnitude and phase • No discrimination between multiple sensors as shown
SAW RFID Practical Approaches • Resonator • Fabry-Perot Cavity • Frequency selective, SAW device Q~10,000 • Code Division Multiple Access (CDMA) • Delay line – single frequency Bragg reflectors • Pulse position encoding • Orthogonal Frequency Coding (OFC) • Delay line, multi-frequency Bragg reflectors • Pulse position encoding • Frequency coupled with time diversity
SAW Resonator Q~10,000 • Resonant cavity • Frequency with maximum returned power yields sensor temperature • High Q, long time response • Coding via frequency domain by separating into bands “Remote Sensor System Using Passive SAW Sensors”, W. Buff, et al, 1994 IEEE International Ultrasonics Symposium
SAW CDMA Delay Line CDMA Tag • CDMA Tag Concept • Single frequency Bragg reflectors • Coding via pulse position modulation • Large number of possible codes • Short chips, low reflectivity - (typically 40-60 dB IL) • Early development by Univ. of Vienna, Siemens, and others
SAW OFC Delay Line Micrograph of device under test (DUT) OFC Tag Bragg reflector gratings at differing frequencies DUT - RF probe connected to transducer • OFC Tag • Multi-frequency (7 chip example) • Long chips, high reflectivity • Orthogonal frequency reflectors –low loss (6-10 dB) • Example time response (non-uniformity due to transducer)
Discussion Resonator, CDMA, and OFC embodiments have all been successfully demonstrated and applied to various applications. Devices and systems have been built in the 400 MHz, 900 MHz and 2.4 GHz bands by differing groups. • Resonator • Minimal delay • Narrowband PG~1 • Fading • Frequency domain coding • High Q – long impulse response • Low loss sensor • CDMA • Delay as reqd. ~ 1usec • Spread Spectrum • Fading immunity • Wideband • PG >1 • Time domain coding • Large number of codes using PPM • OFC • Delay as reqd. ~ 1usec • Spread Spectrum • Fading immunity • Ultra Wide Band • PG >>1 • Time & frequency domain coding • Large number of codes using PPM and diverse chip frequencies
SAW OFC Sensor Introduction Conventional wisdom at the time: • “ Orthogonality in frequency is not feasible with coded reflective passive SAW sensors.”, “Spread Spectrum Techniques for Wireless Interrogable Passive SAW Sensors”, A. Pohl, et. al., IEEE 4th International Symposium on Spread Spectrum Techniques and Applications, 1996, pp. 730. • “D. Malocha and coworkers recently developed Orthogonal Frequency Coding for SAW tags [25]. …….This approach can be applied to sensors and for identification of a limited number of sensors, but it can hardly be used for ID tags with large numbers of codes.” Review on SAW RFID Tags, V. P. Plessky, and L.M. Reindl, IEEE Transactions on Ultrasonics, Ferroelectrics, and Frequency Control, vol. 57, no. 3, March 2010, pp.654 • First OFC publication by UCF group in 2004 and working system in 2009. The use of spread spectrum frequency and time coding had been overlooked as either not possible or too complicated. For RFID sensors, the approach is both feasible, advantageous, and demonstrated.
OFC Historical Development • Chose 1st devices at 250 MHz for feasibility • Several different OFC sensors demonstrated • Demonstrated harmonic operated devices at 456, 915 MHz and 1.6 GHz • Fundamental device operation at 915 MHz • Devices in the +1 GHz range in 2010 • First OFC system at 250 MHz • Current OFC system at 915 MHz • First 4 device wireless operation in 2009 • Mnemonics demonstrates first chirp OFC correlator receiver in 2010
Why OFC SAW Sensors? • A game-changing approach • All advatageous of SAW technology • Wireless, passive and multi-coded sensors • Frequency & time offer greatest coding diversity • Single communication platform for diverse sensor embodiments • Radiation hard • Wide operational temperature range
Schematic of OFC SAW ID Tag Sensor bandwidth is dependent on number of chips and sum of chip bandwidths. Frequency domain of Bragg reflectors: contiguous in frequency but shuffled in time Time domain chips realized in Bragg reflectors having differing carrier frequencies and frequencies are non-sequential which provides coding
Example 915 MHz SAW OFC Sensor f4 f3 f1 f5 f2 US Quarter SAW Sensor SAW OFC Reflector Chip Code FFT
SAW OFC RFID signal – Target reflection as seen by antenna SAW absorber S11 w/ absorber and w/o reflectors S11 w/o absorber and w/ reflectors Coded SAW chips are bound in frequency and received sequentially in time
OFC vs CDMA Number of possible codes versus number of chips for same chip configuration CDMA: # codes=2N OFC: # codes=N!*2N where N= #chips
Effect of Code Collisions from Multiple SAW RFID Tags -Simulation Due to asynchronous nature of passive tags, the random summation of multiple correlated tags can produce false correlation peaks and erroneous information
OFC Coding • Time division diversity (TDD): Extend the possible number of chips and allow delay and phase modulation • # of codes increases dramatically, M>N chips, >2M*N! • Reduced code collisions in multi-device environment Sensor #1 f3 f2 f1 f4
456 MHZ SAW OFC TDD Coding A 456 MHz, dual sided, 5 chip, tag COM-predicted and measured time responses illustrating OFC-PN-TDD coding. Chip amplitude variations are primarily due to polarity weighted transducer effect and fabrication variation.
OFC FDM Coding • Frequency division multiplexing: System uses N-frequencies but any device uses M < N frequencies • System bandwidth is N*Bwchip • OFC Device is M*BWchip • Narrower fractional bandwidth • Lower transducer loss • Smaller antenna bandwidth Sensor #1 f2 f1 f4 f3 f8 f6 f7 f5 Sensor #2 36
SAW Electrically Small Antenna Gain and Bandwidth The plots show that there is a minimum size at a given frequency to attain a desired fractional bandwidth. As the frequency increases, a larger fractional bandwidth is achievable for a smaller antenna size. As the effective size of the antenna increases, the gain and bandwidth both increase.
UCF Initial Design 250 MHz Disk Monopole Antennas Large dinner plate design met fractional bandwidth, but hardly miniature compared to SAW sensor size SAW Target – SAW + Antenna
Target Gain vs. FrequencyAnalysis points to ~1 GHz wherefis in GHz Good fo region %BW SAW, antenna and net gain in dB, and fractional bandwidth, versus frequency for a 3cm radius ESA. Assumes a SAW propagation length of 5 usec.
Wideband Open-Sleeve Dipole Antenna • Designed on 32mil FR4 (εr=4.7 and tan(δ)=0.015) • Entire structure optimized in IE3D between 800MHz and 1GHz 41
SAWtenna @ 915 MHz Fully integrated on-wafer SAW OFC sensor and antenna Wireless OFC SAWtenna time domain response Test wafer-level SAW & antenna integration
Synchronous Transceiver - Software Radio 915 MHz Pulsed RF Transceiver Block Diagram • Pulse Interrogation: Chirp or RF burst • CorrelatorReceiver Synchronous • Software Radio Based
Temperature ExtractionUsing Adaptive Correlator Comparison of ideal and measured matched filter of two different SAW sensors : 5-chip frequency(below) Normalized amplitude (dB) versus time NS401 NS403 Stationary plots represent idealized received SAW sensor RFID signal at ADC. Adaptive filter matches sensor RFID temperature at the point when maximum correlation occurs.
Synchronous Correlator Receiver Block diagram of a correlator receiver using ADC OFC Single Sensor Signal Correlation Output Temperature Extraction
250 MHz Wireless Pulsed RF OFC SAW System - 2nd Pass An OFC SAW temperature sensor data run on a free running hotplate from an improved 250 MHz transceiver system. The system used 5 chips and a fractional bandwidth of approximately 19%. The dashed curve is a thermocouple reading and the solid curve is the SAW temperature extracted data. The SAW sensor is tracking the thermocouple very well; the slight offset is probably due to the position and conductivity of the thermocouple.
MNI Transceiver Design • Pulsed RF Chirp • Correlator Receiver • Synchronous operation • Integration of multiple “pings” • OFC processing gain • Adaptive filter temperature extraction • Software radio based approach for versatility