Neuronal Recording Based Clustering Algorithm
Neuronal Recording Based Clustering Algorithm. Jiang-She Zhang Department of Information Science Xi’an Jiaotong University, Xi’an, 710049 Email:jszhang@mail.xjtu.edu.cn. 1. Introduction.

Neuronal Recording Based Clustering Algorithm
E N D
Presentation Transcript
Neuronal Recording Based Clustering Algorithm Jiang-She Zhang Department of Information Science Xi’an Jiaotong University, Xi’an, 710049 Email:jszhang@mail.xjtu.edu.cn
1. Introduction In this presentation today, we show that there is a deep and useful connection between neuronal recording mechanisms of visual systems and data clustering models in data mining and knowledge discovering, and show how this connection provides a new perspective on traditional data clustering problems and methods.
In the following presentation, we first briefly review the neuronal recording models, explain the postulates on which the models are based, and explore them to construct a new type of robust clustering algorithm. • Then we apply this point of view to a number of illustrating problems, including ones which arising in high energy X-ray computed tomography image processing and electricity power load forecasting. • The discussions follow in the final section.
2. The neuronal recording model Nearly all neural processing models are based on a common set of postulates, these are: • Each visual stimulus i is represented as a vector, Xi , in a stimulus space or feature space. • Each neuron j has a sensitive stimulus called tuned characteristic, Vj ,This tuned characteristic is also called trigger feature, tuned properties or prototype.
3. A neuron fires more or less depending on the extent to which the stimulus pattern match the prototype. 4. The pattern of responses of the neurons faithfully represents the input stimulus.
The following two-stage neuronal recording model of visual system is proposed by L.A.Olzak and J.P.Thomas(1999) and many others: Stage 1: A stimulus is analyzed by a bank of neurons. Stage 2: The output of each neuron is transformed both by a within-pathway nonlinear process and by a divisive pooled gain control process
Let represent the output of neuron i for input stimulus j in stage S. Thus and represents activity with neuron i, but at different stages. In stage 1, the output measures the degree to which the neuron’s tuned characteristic matches to the signal profile, or represents the Similarity between tuned characteristic Vi and stimulus Xj Similarity between Vi and Xj
The second stage combines two independent nonlinear processes. One process is within-pathway nonlinearity that take the form of a hyperbolicration with semisaturation constant C1, and exponent p
The hyperbolic ratio both describes the way in which detection and discrimination performance varies with contrast and the contrast response function of many individual neurons. The second nonlinearity is a divisive gain control, or normalization process that independently acts to attenuate the response of each neuron by a factor governed by the total activity in a pool of neurons
The parameter C2 is a normalized Semisaturation constant. As long as C2 is nonzero, the normalized output will always be finite, even for a zero constant stimulus, saturating for high . The r is the exponent to control the steepness of normalization.
Because gain control alters the height of the log performance versus log but not its shape, it is supposed that the within-pathway nonlinearity and the gain control nonlinearity combine multiplicatively. Therefore, the output of the second stage is · ·
One effect of the exponent is to increase responsiveness of neuron to its optimal stimulus relative to non-optimal stimuli, and hence to increase the selectivity. The gain control mechanism prevents non-optimal stimuli from producing a maximum response no matter what the stimulus amplitude. The response exponent further reduces the possibility that non-optimal stimuli will produce a maximum response.
When , 1 >C1 0 <C1 Therefore, the first nonlinear process will not response to the stimulus whose matching degree less than the threshold C1. Therefore, the representation is robust to noise.
>C2 and j = 1 When >C2 or j 0 That is to say, the neuronal representation is robust to noise, yet sensitive to the signal.
Finally, the faithful representation of stimulus by tuned characteristics of neurons requires minimizing the total distortness E(V)= Where is the dissimilarity measure between and .
Adaptation of tuned characteristics to characterize the distribution of perceivable stimuli is usually called self-organization and it is closely related to many aspects of visual cortical self-organization and development. In this paper, We describe a new learning algorithm by minimizing above objective function as follows
Step 1. Calculate Step 2. Calculate for each i, j Step 3. E(V) Repeat step 1 -3 until convergence
3. Data Clustering Data clustering is a discovering process in data mining, it groups a set of similar objects into clusters on the basis of numerical data. These discovered clusters could help to explain the characteristics of underlying data distribution and serve as the foundation for other data mining and analysis techniques.
The widely used prototype based clustering models are which use the following assumptions . 1. Each object i is represented by a feature vector 2. Each cluster j is represented by a prototype vector 3. Each object belongs to one or several clusters depending on the extent to which matches . 4. The clusters faithfully represent the structure of the data set.
Comparing the postulates underlying the neuronal recording model and clustering model, we can see that there is a correspondence between two models if we use in place of the , defining the similarity between and by where is the dissimilarity between and . =
It is also straightforward with the self-organization algorithm to generate a clustering results. This new clustering algorithm works as follows: Neuronal Recording Based Clustering Algorithm Step 1. = Step 2. Calculate Step 3. vj = argmin Repeat step 1-3 until convergence
Another correspondence we should mention is that the two types of nonlinearities in neuronal recording model correspond with two memberships in cluster analysis: 1.The within-pathway nonlinearity corresponds with possibilistic membership that measures the absolute degree of typicality of a point in any particular cluster. 2.The divisive gain control corresponds with fuzzy membership that measures the relative degree of sharing of a point among the clusters.
4. Numerical Tests We now conduct numerical experiments to show the effectiveness of neuronal recording based clustering algorithm. We adopt the Euclidean distance as the dissimilarity measure. We choose r=2 and we vary p over the rang:1.0<p<10.00.
1) First numerical experiment We generate a data set as shown in fig.1.The actual cluster centers are (1,0), (3,0) and (5,0). The cluster centers determined by Well-known FCM clustering algorithm explicitly shown by large black points. These centers are far away from the actual ones, and therefore the FCM clustering is not robust.
Fig.2: compares another clustering algorithm, possibilistic C-means (PCM), with the neuronal recording based clustering algorithm. The PCM algorithm finds nearly identical clusters over a wide range of its parameters. On the other hand, the neuronal recording based algorithm can always find clusters and their centers are close to the actually ones for all P>1.
(a) PCM algorithm; (b) Neuronal recording based clustering Fig. 2: Results of the PCM algorithm and neuronal recording based clustering in the first numerical experiment.
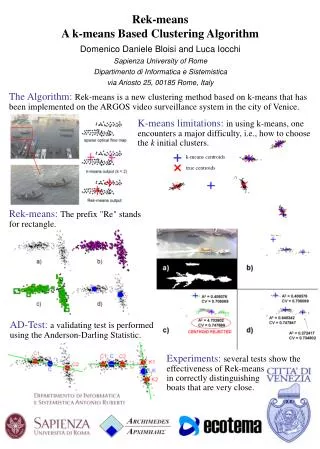
2)Second numerical experiment We consider a high energy X-ray computed tomography image of a mechanical object show in Fig3(a). This computed tomography image is obtained from a research laboratory. To extract useful information form this image, one of the issues is to find the boundaries of its bright shells. For this purpose, we perform spherical shell clustering on the support image obtained by a trous wavelet transformation, shown in Fig3(b). Fig3(c) shows the results obtained by PCM algorithm. The circles found are close to each other and fall in the middle of the actually boundaries. Fig3(d) shows the results obtained by neuronal recording based clustering algorithm. The circles found are well separated and they are on the actual boundaries.
(b) Support image of the significant coefficients (a) A computed tomography image. of a trous wavelet transform at scale 2. (c) Results obtained by the PCM algorithm. (d) Results obtained by neuronal recording The circles found fall in the middle of the based clustering. The circles found lie actual boundaries. on the actual boundaries. Figure 3
3)Third numerical experiment We use a radial basis function neural network to forecast hourly load on an electricity network operated by The Northwest China Electric Power Company in 2001. The neural network is trained by a clustering algorithm and a gradient descent method. The forecasting accuracy is shown in Fig4 when PCM algorithm and neuronal recording based clustering algorithm are, respectively, used in training. The neuronal recording based clustering
algorithm can result in more accurate forecasting results than the PCM algorithm. This is because neuronal recording based clustering algorithm can determine proper clusters, so that the neural network can be trained in a more precise way to give better forecasting results.
Fig.4: The weekly MAPE (mean absolute percentage error) obtained by the PCM algorithm (dash line)and neuronal recording based clustering algorithm (solid line) in the fourth numerical experiment.
5. Discussions and conclusion To summarize. Firstly, we have shown that the analogy between neural processing model and data clustering model provides a natural way for bringing the neuronal recording mechanisms to bear on data clustering. Secondly, the numerical experiments show that the neuronal recording based clustering algorithm is more effective than FCM, PCM and other clustering algorithms. Finally, we would like to mention that the strong robustness shown by neuronal recording based algorithm implies that the neuronal recording mechanisms are strongly robust to noise input, especially immune from outliers.