Download
1 / 31
310 likes | 418 Vues
Outlook for U.S. Retail Food Prices and Inflation, 2013. Richard Volpe, Ph.D. Food Markets Branch Food Economics Division ERS-USDA. Presented at USDA’s Agricultural Outlook Forum February 21, 2013. The Ongoing Drought. 54.23% of USA in moderate or worse drought

E N D
Outlook for U.S. Retail Food Prices and Inflation, 2013 Richard Volpe, Ph.D. Food Markets Branch Food Economics Division ERS-USDA Presented at USDA’s Agricultural Outlook Forum February 21, 2013
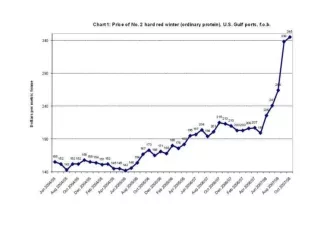
The Ongoing Drought • 54.23% of USA in moderate or worse drought • Largest percentage yet • 34.35% in severe drought or worse • Hard red winter wheat in KS, OK, TX • Warm temps but no moisture • Major concerns begin in the late spring/early summer
Corn sector impacts Higher prices and lower use U.S. corn projections, 2012/13 marketing year, May and October 2012 ------------------------------------------------------- ------------------- ------------------- ------------------- ----------------------- May 2012 Oct. 2012 Percent of Item forecast forecast Change supply change ------------------------------------------------------- ------------------- ------------------- ------------------- ----------------------- Planted acres (million acres) 95.9 96.9 1.0 Harvested acres (million acres) 89.1 87.7 -1.4 Source: Paul Westcott, USDA-ERS Yields: Bushels per harvested acre 166.0 122.0 -44.0 Supply and use (million bushels): Beginning stocks 851 988 137 Production 14,790 10,706 -4,084 Imports 15 75 60 Supply 15,656 11,769 -3,887 100 Feed & residual 5,450 4,150 -1,300 33 Ethanol and by-products 5,000 4,500 -500 13 Other food, seed, & industrial 1,425 1,350 -75 2 Domestic use 11,875 10,000 -1,875 Exports 1,900 1,150 -750 19 Total use 13,775 11,150 -2,625 Ending stocks 1,881 619 -1,262 32 Farm price (dollars per bushel) 4.60 7.80 3.20 ------------------------------------------------------- ------------------- ------------------- ------------------- ----------------------- Note: Marketing year beginning September 1 for corn.
Soybean sector impacts Exports adjust relatively more U.S. soybean projections, 2012/13 marketing year, May and October 2012 ------------------------------------------------------- ------------------- ------------------- ------------------- ----------------------- May 2012 Oct. 2012 Percent of Item forecast forecast Change supply change ------------------------------------------------------- ------------------- ------------------- ------------------- ----------------------- Planted acres (million acres) 73.9 77.2 3.3 Harvested acres (million acres) 73.0 75.7 2.7 Source: Paul Westcott, USDA-ERS Yields: Bushels per harvested acre 43.9 37.8 -6.1 Supply and use (million bushels): Beginning stocks, September 1 210 169 -41 Production 3,205 2,860 -345 Imports 15 20 5 Total supply 3,430 3,050 -380 100 Crush 1,655 1,540 -115 30 Seed and residual 125 115 -10 3 Exports 1,505 1,265 -240 63 Total disposition 3,285 2,920 -365 Ending stocks 145 130 -15 4 Prices: Soybean price, farm ($ per bushel) 13.00 15.25 2.25 Soybean oil (dollars per lb) 0.545 0.550 0.005 Soybean meal (dollars per ton) 350 485 135 ------------------------------------------------------- ------------------- ------------------- ------------------- ----------------------- Note: Marketing year beginning September 1 for soybeans.
What Does this Mean for Consumers? • Food prices increase • Questions abound about market power/retail competitiveness • But nobody will permanently absorb losses post-farmgate • Field corn -> animal feed -> animals -> animal products • Field corn -> corn syrup, corn flour, etc. • Field corn -> ethanol -> production/ transportation
Above-average Food Price Inflation in 2011 • All food: 3.7% • Food-at-home: 4.8% Source: BLS CPI Data, 2011
Further Inflation in 2012 Source: BLS CPI Data, 2012
Food, Energy, Medical Care, Services, 1990-2012 Source: BLS CPI Data, 1970-2012
Where a Consumer Dollar Spent on Food Goes Source: A Revised and Expanded Food Dollar Series (2011), ERR114, Economic Research Service, www.ers.usda.gov/data/FoodDollar/
Consumers Increasingly Shop at Nontraditional Formats Source: Nielsen Homescan Data, 1999-2009
2012-2013 Food Inflation Unlikely to Approach 2007-2008 Levels Source: BLS CPI Data, 1997-2012
But Food Price Inflation Will Continue to Outpace Overall Inflation Source: BLS CPI Data, 2006-2012
Food Inflation 2009-2011 2009 Food commodity costs down from summer 2008 highs Energy prices down Recession leads to weakened domestic and global demand 2010 Sputtering global economy, deflation concerns Renewed commodity price pressures 2011 Higher commodity costs (corn, wheat, soybeans, etc.) Higher energy and transportation costs Increased U.S. exports due to growing global demand, weak U.S. Dollar Large animal supplies at historic lows due to lingering effects of 2008 Retailers slow to pass on cost increases for most of year
Food Inflation 2012 • 2012 • Most inflationary pressures remain but do not intensify • Retailers begin to pass on costs in earnest • US economy improves, dollar strengthens • Domestic demand grows little • Exports fall • Late-2011 surge in prices means higher starting point for year • Drought has modest impacts on animal-based products • Excellent weather and low prices for most fruits and vegetables act to curb inflation
Outlook for 2013 • 2013 • Inflationary pressure on major field crops should ease (weather-dependent) • But high-priced corn, soybeans, and wheat will permeate supermarkets • Structural inflation for beef, pork will intensify • Overall inflation higher than historical average • Weather shocks, high fuel prices could create another 2011
Outlook in Depth: Categories to Watch • Beef and veal • Structural inflation: low supply, high demand • High prices are here to stay: CPI fell three times since 1/11, up 3.5% over 2012 • Only 0.5% for FAH • Finely textured beef controversy was a temporary blip, not a redirection of prices • Prices fell for a couple of months as herds were culled • But structural inflation will only worsen
Outlook in Depth: Categories to Watch • Poultry • Some evidence that consumers are shifting away from beef and pork • Broilers will reflect (have reflected) higher feed prices before cattle, hogs • Strong inflation for 2013 • Weather, rainfall conditions in south most important determinant of poultry inflation
Outlook in Depth: Categories to Watch • Dairy • Production per cow is up, dry milk exports are down • Fluid milk prices were forecast to be flat or slightly down on the year • But fluid milk will be an early indicator of high feed prices • Milk prices surged 4.3% in Q4 2012 • Next is cheese, butter, sour cream, etc.
Outlook in Depth: Categories to Watch • Fruits and vegetables • Crops up, prices down across the board for 2012 • Fruit prices stronger but still down or flat • Vegetable prices achieved rare deflation for a major category in 2012 • The bright spot for consumers in 2012 • Forecast a course correction in 2013
Outlook in Depth: Categories to Watch • ‘Other foods’ • Soups, condiments, packaged sides, etc. • More shelf stability -> slower, less efficient price transmission • Big category felt effects of 2011 in 2012 • Higher commodity prices will filter up and down the aisles through 2013 and even into 2014 • In many cases prices will rise but only the most conscious consumers will notice at the UPC level • Basket costs will rise more substantially
Caveats Food commodity volatility Food ~ Energy Connection Global demand for U.S. exports Retail margin pressure Post-recession consumer response Weather is major source of uncertainty Longer term structural inflation concerns
Resources for Food Price Trends Research • ERS CPI Forecasts http://www.ers.usda.gov/data-products/food-price-outlook.aspx • New ERS Reports http://www.ers.usda.gov/publications/err129/ http://www.ers.usda.gov/Publications/EIB75/ http://www.ers.usda.gov/Publications/ERR105/ • BLS CPI, PPI, and Average Price Data http://data.bls.gov/PDQ/outside.jsp?survey=cu http://data.bls.gov/PDQ/outside.jsp?survey=wp http://data.bls.gov/PDQ/outside.jsp?survey=ap • AMS Fruit and Vegetable Report http://www.ams.usda.gov/mnreports/fvwretail.pdf • IMF World Commodity Prices http://www.imf.org/external/np/res/commod/index.asp
Amber Waves everywhere you want it! • Via web connection: Get Amber Waves monthly features and data from any web connection! The new responsive web design automatically configures to fit mobile devices and tablets. www.ers.usda.gov • Via mobile app: Get the full magazine each quarter delivered to your mobile bookshelf. Available for download on iTunes and Google Play. • Amber Waves magazine presents current ERS economic and policy research on agriculture, food, rural America, and the environment for policymakers, academics and the public.
Contact Information Richard Volpe, PhD rvolpe@ers.usda.gov 202-694-5395 For more information, see http://www.ers.usda.gov/data-products/food-price-outlook.aspx