Download
1 / 47
480 likes | 662 Vues
SOUTHERN REGIONAL LOAD DESPATCH CENTRE BANGALORE. WELCOME TO. ONE DAY WORKSHOP ON AVAILABLE TRANSFER CAPABILITY(ATC) IN INDIAN CONTEXT. 14 TH AUGUST 2007. Power Grid Corporation of India Limited. ATC FUNDAMENTALS. WHY ATC?. Presentation Road Map. What is Transfer Capability

E N D
SOUTHERN REGIONAL LOAD DESPATCH CENTREBANGALORE WELCOME TO ONE DAY WORKSHOP ON AVAILABLE TRANSFER CAPABILITY(ATC) IN INDIAN CONTEXT 14TH AUGUST 2007 Power Grid Corporation of India Limited
ATC FUNDAMENTALS WHY ATC?
Presentation Road Map • What is Transfer Capability • Difference between Transfer Capability and Transmission capacity • Assessment of Transfer Capability • What is reliability Margin why are they required • What are the risks associated with violation of transfer capability in real time • How to Improve Transfer Capability
AIM OF POWER SYSTEM ENGINEERS • EARLIER STATEMENT • To provide Reliable, Stable and Secured Power supply to the end user with Least possible cost • PRESENT STATEMENT • To provide Reliable, StableandSecuredPower supplyto the end user with Least possible costWITH Maximizing profit to all stake holders
Electricity is a scientific phenomenon • EMF travels at the speed of light • Available ‘just-in-time’ • Delivered to the customers fresh • No one get placed on hold • Impartial in its benevolence and wrath • Good servant but a ruthless master • Interconnected systems with thousands of kilometers of transmission lines and hundreds of generators operating with split second synchronism • The largest single machine ever created Grid operation is a continuous interplay of technical phenomena and natural/ human intervention
Power flow characteristics • Is directional • Does not recognize geographical boundaries, asset ownership • Does not check the map to determine the shortest route • Flows are dictated purely by • Impedances of the transmission lines • Point of injection by generators • Point of consumption loads “Time & Location matter is fundamental to operation” -Shmuel Oren & Fernando Alvarado
Some Definitions • ‘TTC is the amount of electric power that can be transferred over the interconnected transmission network in a reliable manner based on all of the following conditions: 1. For the existing or planned system configuration, and with normal (pre-contingency) operatingprocedures in effect, all facility loadings are within normal ratings and all voltages are withinnormal limits. 2. The electric systems are capable of absorbing the dynamic power swings, and remaining stable, following a disturbance that results in the loss of any single electric system element, such as a transmission line, transformer, or generating unit. 3. After the dynamic power swings subside following a disturbance that results in the loss of any single electric system element as described in 2 above, and after the operation of any automatic operating systems, but before any post-contingency operator-initiated system adjustments are implemented, all transmission facility loadings are within emergency ratings and all voltages are within emergency limits.
Some Definitions continued 4.With reference to condition 1 above, in the case where pre-contingency facility loadings reach normal thermal ratings at a transfer level below that at which any first contingency transfer limits are reached, the transfer capability is defined as that transfer level at which such normal ratings are reached. 5 In some cases, individual system, power pool, subregional, or Regional planning criteria or guides may require consideration of specified multiple contingencies, such as the outage of transmission circuits using common towers or rights-of-way, in the determination of transfer capability limits. If the resulting transfer limits for these multiple contingencies are more restrictive than the single contingency considerations described above, the more restrictive reliability criteria or guides must be observed.’
POINT A POINT B TRANSFER CAPABILITY • Transfer Capability’ is the measure of the ability of interconnected electric systems to reliably move power from one area to another over all transmission lines (or paths) between those areas under specified system conditions Transfer Capability is different from ‘Transmission Capacity’, which usually refers to the thermal limit or rating of a particular transmission element or component
A CHAIN IS ONLY AS STRONG AS ITS WEAKEST LINK IN A GRID WITH ELEMENTS IN SERIES AND PARALLEL, THE WEAKEST LINK IN SERIES WOULD DETERMIN THE STRENGTH OF THE NETWORK
Transfer Capability Limits Thermal limit • Thermal Limits establish the maximum electrical current that a transmission line or electrical facility can conduct over specified time periods before it sustains permanent damage by overheating or before it violates public safety requirements Voltage limit System voltages and changes in voltage must be maintained within the acceptable range as defined in the Grid Codes. For example, minimum voltage limits can establish the maximum amount of electric power that can be transferred without causing damage to the electric system or customer facilities. A widespread collapse of system voltage can result in a black out of portions or the entire interconnected network
Stability Limits The transmission network must be capable of surviving disturbance through the transient and dynamic time periods (from milliseconds to several minutes respectively) following a disturbance. All generators connected to ac interconnected transmission system operate in synchronism with each other at the same frequency. Immediately following a system disturbance, generators begin to oscillate relative to each other, causing fluctuations in system frequency, line loadings, and system voltages. For the system to be stable the oscillations must diminish as the electric systems attain a new, stable operating point. If a new, stable point is not quickly established, the generators will likely lose synchronism with one another, and all or a portion of the interconnected system may become unstable. The result of generator instability may damage equipment and cause uncontrolled, widespread interruption of electric supply to customers.
Voltage Limit Total Transfer Capability: TTC Thermal Limit Power Flow Stability Limit Total Transfer Capability Time Total Transfer Capability is the minimum of the Thermal Limit, Voltage Limit and the Stability Limit
“Non-simultaneous Transfer Capability is the amount of electric power that can be reliably transferred between two areas of the interconnected electric system when other concurrent normal base power transfers are held constant.” “Simultaneous Transfer Capability is the amount of electric power that can be reliably transferred between two or more areas of the interconnected electric system as a function of one or more other power transfers concurrently in effect.”
TTC assessment block diagram Planning criteria Credible contingencies CEA CTU STU Anticipated Network topology + Capacity additions Simulation Analysis Brainstorming LGBR Last Year Reports Weather Forecast Anticipated Substation Load Anticipated Ex bus Thermal Generation TTC Anticipated Ex bus Hydro generation Stakeholders Last Year pattern Operating limits Operator experience
ATC TTC
Need for Reliability Margins • Peculiarity in Indian power grids • Difference in Planning assumptions and operating conditions • Forecasting errors • Outage of units etc
Peculiarity in Indian power grids • Haulage of power over long distances • Resource inadequacy leading to high uncertainty in adhering to maintenance schedules • Pressure to meet demand even in the face of acute shortages and freedom to deviate from the drawal schedules. • A statutorily permitted floating frequency band of 49.0 to 50.5 Hz • Non-enforcement of mandated primary response, absence of secondary response by design and inadequate tertiary response. • No explicit ancillary services market • Inadequate safety net and defense mechanism
Difference in Planning assumptions and operating conditions • Planning criteria • The ISTS shall be capable of withstanding and be secured against a selected list of credible contingency outages without necessitating load shedding or rescheduling of generation during Steady State Operation. • The credible contingencies considered are • Outage of a 132 kV D/C line or, • Outage of a 220 kV D/C line or, • Outage of a 400 kV S/C line or, • Outage of single Interconnecting Transformer, or • Outage of one pole of HVDC Bipole line, or • Outage of 765 kV S/C line • Outage of a single largest in feed • Planning is carried out on regional self sufficiency basis • In the proposed Planning criteria six dispatch scenario’s are considered
Difference in Planning assumptions and operating conditions Operating conditions not accounted during planning • Simultaneous outage of more elements like Bus bar operation in a station • Simultaneous outage of generators in a station due to auxiliary supply problem or evacuation line outages • Weather disturbance causing multiple outage of lines in the same corridor • Depletion in Hydro storage and less generation due to fuel shortages • Variations in interregional exchanges • Forecast errors • Transmission lines and generators not coming up as per plan • Re configuration of switching arrangements due to constraints like overloading of lines and transformers • Socio-economic uncertainties in a progressive economy The above causes the difference in transfer capability in real time compared to Planning assumptions
Likely consequences of contingency during various operating conditions Providential escape from ‘the valley of death’ on certain occasions cannot be a justification to operate the system at that edges. Luck is a not a part of operating procedure
Methods to improve TTC We should of strong defence mechanisams like • System Protection schemes • Effective under frequency and under voltage protections • Auto re-closing schemes • Tools for damping the oscillations like TCSC’s • Wide area monitoring and measurement equipment for quick action taking • Improved visualisation to the system operator to take immidiate corrective action • Empowerment of SLDC/Generator operators to take immidiate corrective actions
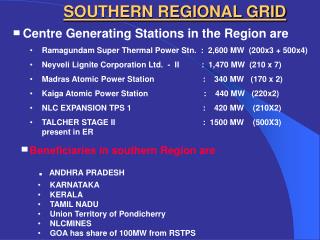
Area : 889,000 SQ KMS Population : 307 Million Peak Demand : 28,000 MW :560 MU / Day REGIONAL GRIDS INSTALLED CAPACITY NORTHERN :- 36,547 MW EASTERN :- 17,159 MW SOUTHERN :- 37,592 MW WESTERN :- 40,280 MW NORTH-EASTERN :- 2,506 MW TOTAL 134,084 MW NORTHERN REGION NORTH-EASTERN REGION EASTERN REGION Area : 425,432 SQ KMS Population : 227 Million Peak Demand : 10,000 MW :200 MU / Day WESTERNREGION Area : 951,488 SQ KMS Population : 230 Million Peak Demand : 29,000 MW :640 MU / Day SOUTHERN REGION Area : 636,249 SQ KMS Population : 223 Million Peak Demand : 25,000 MW :470 MU / Day
RESOURCES ARE FAR AWAY FROM LOAD CENTERS. NECESSITATES LONG TRANSMISSION LINKS FOR EVACUATION HYDRO RESOURCES DELHI Source: Powerline (Siemens Ad), Oct-2006 KOLKATTA MUMBAI COAL BELT BANGALORE CHENNAI AREAS SHOWN ARE APPROXIMATE AND INDICATIVE
NORTHERN REGION NORTH-EASTERN REGION ER WESTERNREGION SOUTHERN REGION THE NATIONAL GRID : PHASE 1 500 MW SASARAM WR-NR HVDC B2B LINK Commissioned in June 2001 500 MW VINDHYACHAL WR-NR HVDC B2B LINK Commissioned in Nov. 1989 BIRPARA(ER) – SALAKATI(NER) 220 KV AC LINK in April 87 EASTERN REGION 400 KV Siliguri-Boangigaon in April 2000 500 MW GAZUWAKA ER-SR HVDC B2B LINK Commissioned in Sep. 1999 500 MW BHADRAWATI WR-SR HVDC B2B LINK Commissioned in Sept. 1997 Bhadrawathi 2nd pole in March, 1998 NATIONAL GRID PHASE-1 COMPLETE
KOLHAPUR NARENDRA-KOLHAPUR D/C AND BACK TO BACK 2X 500 MW HVDC SYSTEM PROPOSED SR WOULD BE SYNCHRONOUSLY CONNECTED WITH REST OF INDIA THROUGH 765 KV D/C RAICHUR-SHOLAPUR-PUNE LINK 1 TALCHER RGM KOLAR SR INTERCONNECTION BY 2012
NORTHERN REGION 11850 MW 5500 MW NORTH-EASTERN REGION 6050 MW 1200 MW WESTERNREGION 1400 MW 6150 MW SOUTHERN REGION INTER-REGIONAL TRANSFER BY END OF 11th PLAN (2012) 4000 MW EASTERN REGION 36,700 MW OF INTER-REGIONAL POWER BY 2012
Source wise composition of installed capacity in India(1,34,084 in 2007) AS on 30-06-07
ALL INDIA GENERATION COMPOSITION Total Market Size = 587.4 BU Total Installed Capacity 1,34,084 MW
Sector wise consumption of electricity in India Total Installed Capacity 1,34,084 MW
ALL INDIA MARKET COMPOSITION (1,34,084 in 2007) AS on 30-06-07
THE SOUTHERN REGION GRID ATC ISSUES AND HOTSPOTS
TWO ELECTRICAL REGIONS w.e.f Aug. 2006 NORTHERN REGION 1 NORTH-EASTERN REGION ‘NEW’ GRID EASTERN REGION TALCHER WESTERNREGION MAJOR INTERCONNECTIONS HVDC INTERCONNECTS 2 SOUTHERN REGION AC INTERCONNECTS 2X500 MW BACK TO BACK STATION AT GAZUWAKA(SR) KOLAR 1000 MW BACK TO BACK STATION AT BHADRAWATI(WR) TALCHER-II TO KOLAR 2000 MW BIPOLE LINK
INTER REGIONAL TRANSFER CAPACITY SR WITH OTHER REGIONS • WITH ER • JEYPORE-GAZUWAKA 1000 MW • TALCHER-KOLAR 2000 MW • WITH WR • RAMAGUNDAM-CHANDRAPUR 1000 MW TOTAL CONCURRENT CAPACITY IS 4000 MW 220 KV LINKS ARE IGNORED BECAUSE THEY ARE NOT IN ACTIVE USE
BHADRWATHI 160607 252 252 105155 187 197 49.42 406 195 SIMHADRI 197 RAMAGUNDAM 242 236 242 240 404 406 202 KALPAKA 344 329 343 343 205 P 198 409 35 43 348 343 0 KHAMMAM GAZUWAKA 1 GAZUWAKA 402 MMDPLI 227 408 258 P GHANAPUR P 1 200 68 VEMAGIRI 225 320 MBN 267 P 0 123 0 0 2 NARENDRA RAICHUR 147 0 147 398 NUNNA P 243 403 NSR 406 1 KNL 409 119 272 265 SSLM 52 303 406 407 P MUNIRABAD 284 209 KAIGA 381 314 v 299 20 389 N P 218 GOOTY 232 409 341 RAYALASEEMA AXIS KADAPA 229 P GUTTUR 404 108 405 NELLORE 273 96 278 HIRIYUR 396 37 405 TALGUPPA 401 1542 1 391 110 34 318 HOODY CHITTOOR 185 NLM 410 397 MADRAS 386 17 0 P KOLAR 401 388 MAPS 71 S'HALLI 143 141 395 HOSUR 257 403 107 78 420 419 SALEM 321 NEYVELI 397 300 402 221 133 151 404 131 UDUMALPET 158 P TRICHY 251 TRICHUR 123 P 396 280 384 253 123 391 MADURAI 403 119 122 THIRUVANANTHAPURAM 399 SR GRID MAP GENERAL DIRECTION OF POWER FLOW IS FROM NORTH TO SOUTH
UI IMPORT BY SR FROM CG ON 05-MAR-07 PEAK IMPORT OF 3670 MW FROM ‘NEW’ GRID UI IMPORT FROM CG CG FREQ SR FREQ 20.31 MUs IMPORTED FROM CG AMOUNT SAVED FOR SR CONSTITUENTS = 2.20 CRs
AREAS OF CONSTRAINT • HYDERABAD URBAN AREA • HIGH 400/220 KV ICT LOADINGS • 220 KV LINE OVER LOADING • DEC TO FEB • SENSITIVE TO IMPORT FROM WR AT RAMAGUNDAM • NEW STATIONS PLANNED………..WOULD BE IN PLACE BY 2008-9 • SRISAILAM EVACUATION PROBLEMS • DEPENDS ON RAINFALL IN CATCHMENT AREA (N KARNATAKA, SW MAHARASHTRA) • OVERLOADING OF SRISAILAM-KURNOOL AND KURNOOL-GOOTY 400 KV S/C LINKS • SENSITIVE TO IMPORT FROM GAZUWAKA AREA • NO TIME FRAME AS YET FOR AUGMENTATION • NUNNA-NELLORE D/C LINK • WOULD BE SOLVED WITH NEW GENERATION COMING UP SOUTH BY 2009 • GOOTY-BANGALORE CORRIDOR • FULL GENERATION AT RAICHUR, ALMATTI, BTPS AND IMPORT FROM WR/ER • WIND ENERGY EVACUATION ISSUES IN SOUTH TAMILNADU • 2000 MW WIND IN TN, PARTICULARLY ALONG KERALA BORDER AND IN KANYAKUMARI AREA • EVACUATION PROBLEMS AS NETWORK WAS NOT DESIGNED FOR THIS • DEDICATED SS AND TL IN PROGRESS • WOULD SATURATE AT 4000-5000 MW • SEASONAL AND UNPREDICTABLE • CONSTRAINT – KERALA HAS TO MAINTAIN HYDRO TO PREVENT LINE OVERLOADING
HOT SPOTS • COIMBATORE AREA • LINE OVERLOADING PROBLEMS • MADRAS CITY • 110 KV GMR VASAVI EVACUATION • ROW PROBLEMS • BANGALORE CITY SUBTRANSMISSION • RELIABILITY ISSUES