Download
1 / 18
180 likes | 414 Vues
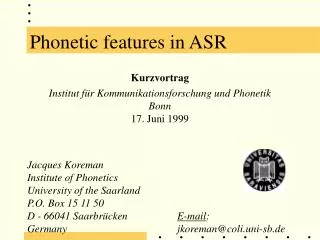
Phonetic features in ASR. Kurzvortrag Institut für Kommunikationsforschung und Phonetik Bonn 17. Juni 1999 Jacques Koreman Institute of Phonetics University of the Saarland P.O. Box 15 11 50 D - 66041 Saarbrücken E-mail : Germany jkoreman@coli.uni-sb.de. ICSLP’98.

E N D
Phonetic features in ASR Kurzvortrag Institut für Kommunikationsforschung und PhonetikBonn17. Juni 1999 Jacques KoremanInstitute of PhoneticsUniversity of the SaarlandP.O. Box 15 11 50D - 66041 Saarbrücken E-mail: Germany jkoreman@coli.uni-sb.de
ICSLP’98 Do phonetic features help to improve consonant identification in ASR? Jacques KoremanBistra AndreevaWilliam J. Barry Institute of Phonetics, University of the SaarlandSaarbrücken, Germany
INTRODUCTION Variation in the acoustic signal is not a problem for human perception, but causes inhomogeneity in the phone models for ASR, leading to poor consonant identification. We should Bitar & Espy-Wilson do this by using a knowledge-based event-seeking approach for extracting phonetic features from the microphone signal on the basis of acoustic cues. We propose an acoustic-phonetic mapping procedure on the basis of a Kohonen network. “directly target the linguistic information in the signal and ... minimize other extra-linguistic information that may yield large speech variability” (Bitar & Espy-Wilson 1995a, p. 1411)
DATA Texts English, German, Italian and Dutch texts from the EUROM0 database, read by 2 male + 2 female speakers per language
DATA Signals • 12 mel-frequency cepstral coefficients (MFCC’s) • energy • corresponding delta parameters Hamming window: 15 ms step size: 5 ms pre-emphasis: 0.97 16 kHz microphone signals
SYSTEM ARCHITECTURE consonant lexicon hidden Markov modelling language model BASELINE phonetic features BASELINE Kohonen network Kohonen network Kohonen network MFCC’s + energy delta parameters C
CONFUSIONS BASELINE (by Attilio Erriquez) phonetic categories: manner, place, voicing 1 category wrong 2 categories wrong 3 categories wrong
CONFUSIONS MAPPING (by Attilio Erriquez) phonetic categories: manner, place, voicing 1 category wrong 2 categories wrong 3 categories wrong
total of all correct identification percentages number of consonants to be identified ACIS = The Average Correct Identification Score compensates for the number of occurrences in the database, giving each consonant equal weight. It is the total of all percentage numbers along the diagonal of the confusion matrix divided by the number of consonants. Baseline system: 31.22 % Mapping system: 68.47 %
% correctcons.baselinemappinglanguage 100.0 75.0 German 100.0 100.0 Italian 100.0 100.0 Italian 97.8 91.3 English 94.1 100.0 Engl., It. 91.2 96.5 English x 88.2 93.4 G, NL BASELINE SYSTEM • good identification of language-specific phones • reason: acoustic homogeneity • poor identification of other phones
% correctcons. baseline mapping language h 6.7 86.7 E,G, NL k 0.0 58.2 all b 0.0 44.0 all d 0.4 36.9 all t 5.9 38.3 all p 1.4 33.3 all etc. MAPPING SYSTEM • good identification, also of acoustically variable phones • reason: variable acoustic parameters are mapped onto homogenous, distinctive phonetic features
APMS = phonetic misidentification coefficient sum of the misidentification percentages The Average Phonetic Misidentification Score gives a measure of the severity of the consonant confusions in terms of phonetic features. The multiple is the sum of all products of the misidentification percentages (in the non-diagonal cells) times the number of misidentified phonetic categories (manner, place and voicing). It is divided by the total of all the percentage numbers in the non-diagonal cells. Baseline system: 1.79 Mapping system: 1.57
APMS = phonetic misidentification coefficient sum of the misidentification percentages • after mapping, incorrectly identified consonant is on average closer to the phonetic identity of the consonant which was produced • reason: the Kohonen network is able to extract linguistically distinctive phonetic features which allow for a better separation of the consonants in hidden Markov modelling.
cons.identified as r g (61%), (16%), (13%) j (53%), j (18%), (12%), (6%), r (6%), (6%) m (23%), (18%), m (16%), (13%), (10%) n (28%), (18%), (16%), (12%), m (8%), (8%) (42%), (15%), (15%), m (8%), (8%), (8%) cons.identified as r r (84%), (5%), l (4%) jj (94%), z (6%) mm (63%), n (11%), (10%), r (6%) n n (26%), m (21%), (20%), r (6%) (46%), n (23%), m (15%), (8%) CONSONANT CONFUSIONS BASELINE MAPPING
CONCLUSIONS Acoustic-phonetic mapping helps to address linguistically relevant information in the speech signal, ignoring extra-linguistic sources of variation. The advantages of mapping are reflected in the two measures which we have presented: • ACIS shows that mapping leads to better consonant identification rates for all except a few of the language-specific consonants. The improvement can be put down to the system’s ability to map acoustically variable consonant realisations to more homogeneous phonetic feature vectors.
CONCLUSIONS Acoustic-phonetic mapping helps to address linguistically relevant information in the speech signal, ignoring extra-linguistic sources of variation. The advantages of mapping are reflected in the two measures which we have presented: • APMS shows that the confusions which occur in the mapping experiment are less severe than in the baseline experiment from a phonetic point of view. There are fewer confusions on the phonetic dimensions manner, place and voicing when mapping is applied, because the system focuses on distinctive information in the acoustic signals.
SUMMARY Acoustic-phonetic mapping leads to fewer and phonetically less severe consonant confusions.
THE END THANK YOU FOR YOUR ATTENTION! http://www.coli.uni-sb.de/~koreman