Download
1 / 15
150 likes | 326 Vues
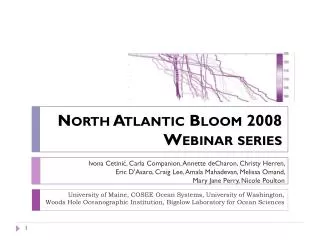
Ivona Cetinić , Carla Companion, Annette deCharon , Christy Herren , Eric D'Asaro , Craig Lee, Amala Mahadevan , Melissa Omand , Mary Jane Perry, Nicole Poulton. North Atlantic Bloom 2008 Webinar series . University of Maine, COSEE Ocean Systems , University of Washington,

E N D
Ivona Cetinić, Carla Companion, Annette deCharon, Christy Herren, Eric D'Asaro, Craig Lee, AmalaMahadevan, Melissa Omand, Mary Jane Perry, Nicole Poulton North Atlantic Bloom 2008 Webinar series University of Maine, COSEE Ocean Systems, University of Washington, Woods Hole Oceanographic Institution, Bigelow Laboratory for Ocean Sciences
The 2008 North Atlantic Bloom Experiment:Autonomous Sampling in a Lagrangian Frame • Bloom Dynamics • Carbon cycle associated mechanisms • Climate change… • Early April • Float and glider deployment • May • Process cruise • June • Recover floats and gliders 4 cruises 70 float-days 340 glider-days 100 channels of realtime data Alkire et al., in press
Gliders- Survey around floats. Profile to 1000 m every 4-5 h. R/V Knorr R/V Sæmundsson Extensive biological and chemical measurements, calibration data, scale check Lagrangian Float Cycle within mixed layer. Profile to 250 m every 24-36 h.
Collaboration with Center for Ocean Sciences Education Excellence (COSEE) - Ocean Systems • To broadly disseminate results and contribute to the public’s understanding of ocean science, NAB08 participants collaborated with the COSEE - Ocean Systems • Identified five theme areas to fit a five-part webinar series • Invited/involved seven presenters from four institutions • Included efforts to make the series a connected story • Targeted audience: • middle school and high school educators (both formal and informal)
Webinar • Presentation • Concept map • Interactive Q&A • Dataset
Webinar - Concept map Emphasizes key concepts and the connections between concepts Relates specific topics to the “big picture” Non-linear presentation that is adjustable to an audience’s prior knowledge Numerous assets that can be linked to a specific “concept” Provides a visual overview to orient an audience and help the presenter field questions
Webinar Presentation Interactive Q&A Dataset Source: NASA
The last graph you showed, you suggested that the “dips” in chlorophyll on that graph were due to mixing -by storms- taking some of the algae that were up in the ‘measured point’ in the water, I guess, - taking them out of that area because of the mixing. Is that correct? Webinar Presentation Interactive Q&A Dataset Did you use satellite imagery to determine where to release the floats and seagliders in order to get the best data possible? Where do these phytoplankton that are in the spring bloom go over the winter? If they all die, are there seeds or something that allow them to come back next year? Is anything measured in the North Atlantic bloom experiment being used to improve climate models? How can you apply all this data that we’re getting to help the average person? Is that a possibility? Is there any other study that has been done in any other part of the global ocean that could be used in a classroom to compare with what you all have seen compared to what they’ve seen?
Dataset contains (Excel): • CTD Tools and Sensors • Float Tools and Sensors • Glossary • CTD Dataset • Float Dataset • Example of Plots CTD • Example of Plots Float • Related Data-Based Activity • Growth & Loss (Exponentials) • Mixed Layer Depth • Temporal and Spatial Scales • Phytoplankton Composition and Nutrients • Density and Deep Convection Webinar Presentation Interactive Q&A Dataset
Webinar Presentation Interactive Q&A Dataset Physics of the bloom by Amala Mahadevan and Melissa Omand (WHOI) Light vs. depth Phytoplankton vs. time
Outcomes • 68 unique participants from 21 states (+ Canada, Iceland and Germany) • 51 % educators, 31 % scientists/grad students • Average 28 participants/webinar • high “return rate” – over 30% attended three or more live webinars in the series. • Other metrics: • Second (to home page) most viewed page on the OS site (since the series began in July 2011)
Outcomes – all materials archived @http://cosee.umaine.edu/programs/webinars/nab Transcripts Videos Interactive concept maps Assets (figures, photos, videos) Dataset ( + video walk-though)
Outcomes (scientists perspective) Source: COSEE-OS
Thank you for your attention • For more details, videos, transcripts and dataset – @ COSEE-OS: http://cosee.umaine.edu/programs/webinars/nab • Complete NAB08 dataset @ BCO-DMO: http://osprey.bcodmo.org/project.cfm?flag=view&id=102&sortby=project • Funding graciously provided by: NSF