CSE 3: Fluency With Information Technology WI 10
10 likes | 151 Vues
CSE 3: Fluency With Information Technology WI 10. Sarah Carmona 3/12/2010. Class Overview.

CSE 3: Fluency With Information Technology WI 10
E N D
Presentation Transcript
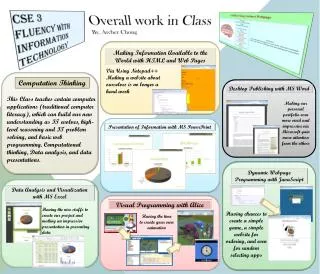
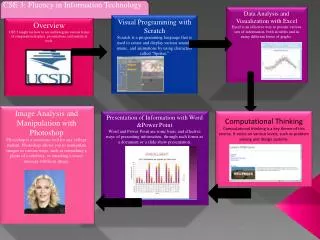
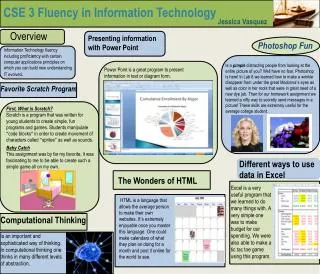
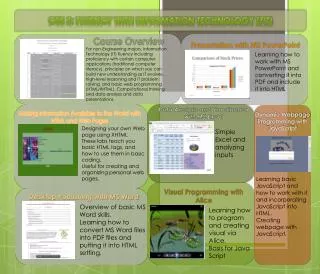
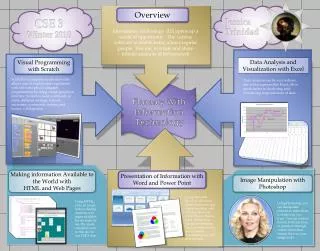
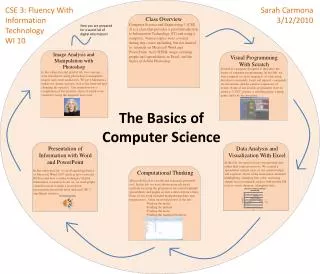
CSE 3: Fluency With Information Technology WI 10 Sarah Carmona 3/12/2010 Class Overview Computer Science and Engineering 3 (CSE 3) is a class that provides a good introduction to Information Technology (IT) and using a computer. Various topics were covered during this course including, but not limited to: tutorials on Microsoft Word and PowerPoint, basic HTML usage, creating graphs and spreadsheets in Excel, and the basics of Adobe Photoshop. Now you are prepared for a world full of digital information! Image Analysis and Manipulation with Photoshop Visual Programming With Scratch Scratch is a program designed to introduce the basics of computer programming. In this lab, we were required to create sequences of code using broadcast commands, loops and repeats, commands for movement, and the general sequencing of events. Some of our scratch assignments were to create a “CSE3” picture, a catching game, a pong game, and a tic-tac-toe game. In this rather fun and playful lab, two concepts were introduced: using photoshop to manipulate images and create animations. We gave Madonna a makeover (using concepts such as the band-aid and changing the opacity). Our animation was a compilation of five pictures, three of which were created by using the magnetic lasso tool. The Basics of Computer Science Presentation of Information with Word and PowerPoint Data Analysis and Visualization With Excel In this lab, we analyzed our own personal data, rather than some given to us. We created a spreadsheet and pie chart of our current budget and expenses. Some of the main points included highlighting, changing font color, and using simple excel commands such as Add and the Fill tools to create dynamic (changing) data. In this multi-part lab, we first learned the basics of Microsoft Word 2007 (such as how to use the Ribbon) and how to make webpages/ display information accurately. Later on, we used graphs created in excel to make a powerpoint presentation about both buoy data and CSE 3 enrollment statistics. Computational Thinking • Microsoft Excel is a useful and extremely powerful tool. In this lab, we were shown more advanced methods for using the program as we created multiple spreadsheets and graphs on data collected from a buoy. Some of our work included manipulating dates and temperatures. Other interesting points of the lab: • Finding the mean • Finding the median • Finding the mode • Finding the standard deviation