Download
1 / 22
220 likes | 467 Vues
Measures of Position and Outliers. z-score (standard score) = number of standard deviations that a given value is above or below the mean (Round z to two decimal places). Ordinary values: between and including -2 and 2 Unusual values: less than -2 and greater than 2.

E N D
z-score (standard score) = number of standard deviations that a given value is above or below the mean(Round z to two decimal places)
Ordinary values: between and including -2 and 2Unusual values: less than -2 and greater than 2
1. Determine which student did better In the 8:00 college algebra class, on the first test the mean was 75 with a standard deviation of 3, Bill was in this class and got a 82. In the 10:00 college algebra class, on the first test the mean was 83 with a standard deviation of 2, Sally was in this class and got 83. Did Sally or Bill do better relative to their classes?
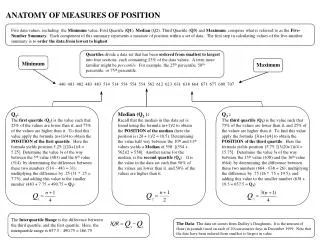
kth Percentile (Pk) The kth percentile of a set of data is a value such that k percent of the observations are less than or equal to the value
*Quartiles : Divides the data into four equal parts (Q1, Q2, Q3)*Deciles : Divides the data into ten equal parts (D1, D2,…,D9)*Percentiles : Divides the data into 100 equal parts (P1,…,P99)
Finding Quartiles (By Hand) • Arrange the data in ascending order • Determine the median, M, or second quartile, Q2 • Divide the data set into halves: the observations below (to the left of) M and the observations above M. The first quartile, Q1, is the median of the bottom half and the third quartile, Q3, is the median of the top half
2. Find the quartiles of the following data 33, 37, 43, 51, 62, 65, 72, 83, 91, 105, 110, 201, 305, 317, 320, 330
Find Quartiles (By TI-83/84) • Input numbers, then “2nd” “mode” to exit out • “stat” button, “right arrow” to CALC, “enter” on 1-varstats, “enter” Note: down arrow to see quartiles
3. Find the quartiles of the following data 2, 8, 33, 45, 71, 83, 91, 105, 113, 235, 471, 512, 513, 555, 1002
4. Find the percentile of a number in a list Given: • 18 23 24 27 33 38 41 52 63 • 81 88 91 99 Find the percentile of 33
Find the nth Percentile (Pk) • Sort the data • Compute the Locator Value: i = (k/100)(n+1)k=percentile in questionn=number of values Note: i is the position of your answer in the list • If i has no decimals: Percentile= ith valueIf it has decimals: Percentile = Average of the two numbers it falls between (position wise).
5. Find the nth percentile Given: 17 21 25 31 43 • 71 83 91 105 210 233 301 315 320 Find P25
6. Find the nth percentile Given: 17 21 25 31 43 • 71 83 91 105 210 233 301 315 320 Find P17
Quartiles to Percentiles • 25th percentile = 1st quartile • 50th percentile = 2nd quartile • 75th percentile = 3rd quartile
Other Formulas • Interquartile range (IQR) = Q3 – Q1 • Semi-interquartile range = (Q3 - Q1) / 2 • Midquartile = (Q3 + Q1) / 2 • 10-90 percentile range = P90 – P10
Definitions • Outliers = Extreme observations
Checking for Outliers by Using Quartiles • Determine Q1 and Q3 • Find IQR = Q3 – Q1 • Determine the fences (fences serve as cutoff points for determining outliers) Lower Fence = Q1 – 1.5(IQR) Upper Fence = Q3 + 1.5(IQR) • Outliers are values less than lower fence or greater than upper fence
7. Given the population data below, find the following:a) Compute the z-score corresponding to 5.3b) Determine the quartilesc) Compute the interquartile range (IQR)d) Determine the lower and upper fences, are there any outliers?