Download

1 / 18
570 likes | 1.79k Vues
Section 3.4. Measures of Position. Objectives. Identify the position of a data value in a data set, using various measures of position such as percentiles, deciles, and quartiles. Measures of Position (or Location or Relative Standing).

E N D
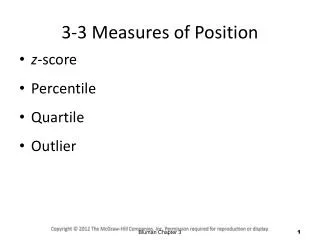
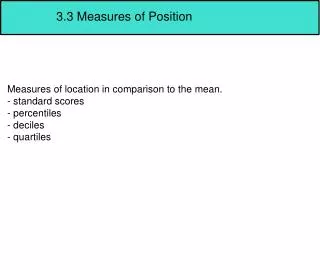
Section 3.4 Measures of Position
Objectives • Identify the position of a data value in a data set, using various measures of position such as percentiles, deciles, and quartiles
Measures of Position (or Location or Relative Standing) • Are used to locate the relative position of a data value in a data set • Can be used to compare data values from different data sets • Can be used to compare data values within the same data set • Can be used to help determine outliers within a data set • Includes z-(standard) score, percentiles, quartiles, and deciles
Z score or Standard Score • Can be used to compare data values from different data sets by “converting” raw data to a standardized scale • Calculation involves the mean and standard deviation of the data set • Represents the number of standard deviations that a data value is from the mean for a specific distribution • We will use extensively in Chapter 6
Z-Score • Is obtained by subtracting the mean from the given data value and dividing the result by the standard deviation. • Symbol of BOTH population and sample is z • Can be positive, negative or zero • Formula • Population • Sample
Example: Who is relatively taller-Lyndon Johnson or Shaquille O’Neal • Lyndon Johnson was 75 inches tall • The tallest president in the past century x-bar (mean) =71.5 in s = 2.1 in • Shaquille O’Neal is 85 inches tall • The tallest player on the Miami Heat basketball team
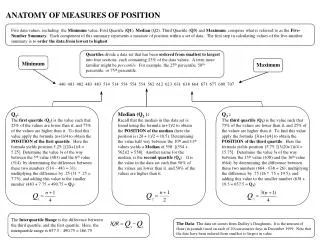
Percentiles • Are position measures used in educational and health-related fields to indicate the position of an individual in a group • Divides the data set in 100 (“per cent”) equal groups • Used to compare an individual data value with the national “norm” • Symbolized by P1, P2 ,….. • Percentile rank indicates the percentage of data values that fall below the specified rank
Examples • Thad scored 22 on the ACT. What is his percentile rank? • Ansley scored 20 on the ACT. What is her percentile rank?
Finding a Data Value Corresponding to a Given percentile • Step 1: Arrange data in order from lowest to highest • Step 2: Substitute into the formula where n is total number of values and p is given percentile • Step 3: Consider result from Step 2 • If c is NOT a whole number, round up to the next whole number. Starting at the lowest value, count over to the number that corresponds to the rounded up value • If c is a whole number, use the value halfway between the cth and (c+1)st value when counting up from the lowest value
Examples To be in the 90th percentile, what would you have to score on the ACT? Find P85
Quartiles • Same concept as percentiles, except the data set is divided into four groups (quarters) • Quartile rank indicates the percentage of data values that fall below the specified rank • Symbolized by Q1 , Q2 , Q3 • Equivalencies with Percentiles: • Q1 = P25 • Q2 = P50 = Median of data set • Q3 = P75 Minitab calculates these for you.
Deciles • Same concept as percentiles, except divides data set into 10 groups • Symbolized by D1 , D2 , D3 , … D10 • Equivalencies with percentiles • D1 = P10 D2 = P20 …….. • D5 = P50 =Q2 =Median of Data Set
Interquartile Range • “Rough” measurement of variability • Used to identify outliers • Used as a measure of variability in Exploratory Data Analysis • Defined as the difference between Q1 and Q3 • Is range of the middle 50% (“average”) of the data set IQR = Q3 – Q1
Outliers • Outlier is an extremely high or an extremely low data value when compared with the rest of the data values • A data set should be checked for “outliers” since “outliers” can influence the measures of central tendency and variation (mean and standard deviation)
How To Identify Outliers • Step 1: Arrange data in order • Step 2: Find Q1 and Q3 • Step 3: Find the IQR • Step 4: Multiply IQR by 1.5 • Step 5: Subtract the value obtained in step 4 from Q1 and add to Q3 • Step 6: Check the data set for any data value that is smaller than Q1 -1.5IQR or larger than Q3 + 1.5IQR
Examples • Emily scored 11 on the ACT. Would her score be considered an outlier? • Danielle scored 38 on the ACT. Would her score be considered an outlier?
Why Do Outliers Occur? • Data value may have resulted from a measurement or observational error • Data value may have resulted from a recording error • Data value may have been obtained from a subject that is not in the defined population • Data value might be a legitimate value that occurred by chance (although the probability is extremely small)