1 Operations Strategy 2 Process Analysis 3 Lean Operations 4 Supply Chain Management
240 likes | 596 Vues
Operations Management & Performance Modeling. 1 Operations Strategy 2 Process Analysis 3 Lean Operations 4 Supply Chain Management 5 Capacity Management in Service 6 Quality Management Class 7b: Quality & the Voice of the Customer The Goal: summary What is Quality? Hank Kolb

1 Operations Strategy 2 Process Analysis 3 Lean Operations 4 Supply Chain Management
E N D
Presentation Transcript
Operations Management & Performance Modeling 1 OperationsStrategy 2 Process Analysis 3 Lean Operations 4 Supply Chain Management 5 Capacity Management in Service 6 Quality Management • Class 7b: Quality & the Voice of the Customer • The Goal: summary • What is Quality? • Hank Kolb • Voice of the Customer 7 Business Process Reengineering OM&PM/Class 7b
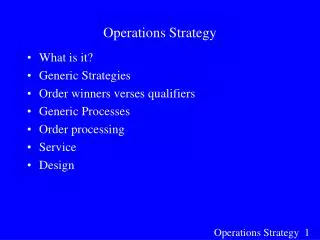
Levers for Reducing Flow Time • “is to decrease the work content of (only ?) critical activities”, • and/or move it to non critical activities. • Reduce waiting time: • reduce variability • arrivals & service requests • synchronize flows within the process • increase safety capacity • lower utilization • Pooling • Match resource availability with flows in and out of process OM&PM/Class 7b
E.g.: Analysis of Service Systems • Divide day into blocks based on arrival rates • For each block evaluate performance measures given current staffing • Quantify financial impact of each action • Workforce training: reduces mean and variability of service time • Work flexibility from workforce: pools available capacity • Time flexibility from workforce: better synchronization • Retain experienced employees: increased safety capacity • Additional workforce: Increases safety capacity • Improved Scheduling: better synchronization • Incentives to affect arrival patterns: better synchronization • Decrease product variety: reduces variability of service time • Increase maximum queue capacity • Consignment program, fax, e-mail etc. S D OM&PM/Class 7b
Framework for Process Flow Management Flow Chart Process Identify Bottlenecks Maximal Flow Rate Identify Critical Path Minimal Flow Time mean Macro Average Performance Process Re-Design No Competitive? Demand Pattern Yes Micro Variability Performance Demand & Supply Mgt No Competitive? variability Continuous Improvement Yes OM&PM/Class 7b
Dimensions of Quality • Performance • Features • Reliability • Conformance • Durability • Serviceability • Aesthetics • Perceived Quality OM&PM/Class 7b
Elements of TQM • Management by fact • Cross-functional (process) approach • Culture and leadership • Customer focus • Employee focus • High performance focus • Continuous improvement • Benchmarking • External alliances - the value chain Source: Eitan Zemel OM&PM/Class 7b
Malcolm Baldrige National Quality Award • 1 Leadership 110 • 2 Strategic Planning 80 • Strategy Development Process • 3 Customer and Market Focus 80 • 4 Information and Analysis 80 • 5 Human Resource Development and Management 100 • 6 Process Management 100 • Product and Service Processes • Support Processes • Supplier and Partnering Processes • 7 Business Results 450 • TOTAL POINTS 1000 OM&PM/Class 7b
Ames Rubber Corporation (1993) Armstrong World Industries Building Products Operations (1995) AT&T Consumer Communications Services (1994) AT&T Network Systems Group (1992) AT&T Universal Card Services (1992) Cadillac Motor Car Company (1990) Corning Telecommunications Products Division (1995) Eastman Chemical Company (1993) Federal Express Corporation (1990) Globe Metallurgical Inc. (1988) Granite Rock Company (1992) GTE Directories Corporation (1994) IBM Rochester (1990) Marlow Industries (1991) Milliken & Company (1989) Motorola Inc. (1988) The Ritz-Carlton Hotel Company (1992) Solectron Corporation (1991) Texas Instruments Incorporated - Defense Systems & Electronics Group (1992) Wainwright Industries, Inc. (1994) Wallace Co., Inc. (1990) Westinghouse Electric Corporation - Commerical Nuclear Fuel Division (1988) Xerox Corporation - Business Products & Systems (1989) Zytec Corporation (1991) Malcolm Baldridge Award Winners Last Updated: November 8, 1996 OM&PM/Class 7b
ISO 9000 • Series of standards agreed upon by the International Organization for Standardization (ISO) • Adopted in 1987 • More than 100 countries • A prerequisite for global competition? • ISO 9000: “document what you do and then do as you documented.” Design Procurement Production Final test Installation Servicing ISO 9003 ISO 9002 ISO 9001 Source: Adapted from Chase & Aquilano OM&PM/Class 7b
Quality Lever Benefits of Building Q in Early Product Design Process Design Production Improve Product 100:1 10:1 1:1 Time High Visibility Reward Low Visibility Reward Costs of Quality • Cost of Conformance • Cost of Appraisal • Cost of Prevention • Cost of Non-Conformance • Cost of Internal Failure • Cost of External Failure OM&PM/Class 7b
Components of Quality • Voice of the customer • Customer Needs • Quality of Design • Voice of the process • Quality of Conformance • Process Capability • Process Control and Improvement OM&PM/Class 7b
Reliability (40 %) % Repair Call Product (30%) Easy to Use (20%) % Calls for Help Features/Functions (40%) Function Performance Test Knowledge (30%) Supervisor Observations Sales (30%) Response (25%) % Proposals Mad on Time Follow-Up (10%) % Follow-Up Made Delivery Interval (30%) Average Order Interval Overall Quality Installation (10%) Does Not Break (25%) % Repair Reports Installed When Promised % Installed on Due Date No Repeat Trouble (30%) % Repeat Reports Repair (15%) Fixed Fast (25%) Average Speed of Repair Kept Informed (10%) % Customers Informed Accuracy, No Surprise (45%) % Billing Inquiries Billing (15%) Response on First Call (35%) % Respolved First Call Easy to Understand (10%) % Billing Inquiries Voice of the Customer: Linking Customer Needs to Business Processes Business ProcessCustomer NeedInternal Metric Source: Kordupleski et al., CMR ‘93. OM&PM/Class 7b
Voice of the Customer: Quality Function Deployment • What do customers want? • Are all preferences equally important? • Will delivering perceived needs deliver a competitive advantage? • How can we change the product? • How do engineering characteristics influence customer perceived quality? • How does one engineering attribute affect another? • What are the appropriate targets for the engineering characteristics? OM&PM/Class 7b
Correlation: Strong positive X Positive X X Negative X X X Strong negative * Engineering Characteristics Competitive evaluation X = Ours Check force on level ground Energy needed to close door Energy needed to open door Accoust. Trans. Window Door seal resistance Water resistance A = Comp. A Importance to Cust. B = Comp. B Customer Requirements (5 is best) 1 2 3 4 5 AB X X Easy to close 7 X AB Stays open on a hill 5 Easy to open 3 XAB A X B Doesn’t leak in rain 3 No road noise 2 X A B Relationships: Importance weighting 10 6 6 9 2 3 Strong = 9 Medium = 3 Target values Reduce energy level to 7.5 ft/lb Small = 1 Reduce energy to 7.5 ft/lb. Reduce force to 9 lb. Maintain current level Maintain current level Maintain current level 5 BA BA B B BXA X Technical evaluation (5 is best) B 4 X A X A 3 A X 2 X 1 House of Quality Source: Hauser and Clausing 1988
Engineering Characteristics Parts Characteristics Key Process Characteristics Production Characteristics I II III IV Engineering Characteristics Parts Characteristics Key Process Characteristics Customer Attributes House of Quality Parts Deployment Process Planning Production Planning Linked Houses From Customer To Manufacturing OM&PM/Class 7b
Design Changes US Japan Before QFD After QFD (39% of preQFD costs) 90% of total Japanese changes complete Job # 1 Job # 1 20 - 24 months 14 - 17 months 1 - 3 months 1 - 3 months time t Benefits of QFD Startup and Preproduction costs at Toyota Auto Body Japanese automaker with QFD made fewer changes than US company without QFD Source: Hauser and Clausing 1988 OM&PM/Class 7b
More New Product Development Tools • Value analysis / Value engineering • Design for manufacturability • Robust design OM&PM/Class 7b
Value Analysis/Value Engineering • Achieve equivalent or better performance at a lower cost while maintaining all functional requirements defined by the customer • Does the item have any design features that are not necessary? • Can two or more parts be combined into one? • How can we cut down the weight? • Are there nonstandard parts that can be eliminated? OM&PM/Class 7b
Non-conformance to design cost $$$ 0 Actual value Lower Tolerance Design Spec Upper Tolerance Lower Tolerance Design Spec Upper Tolerance Robust Quality: Taguchi’s View of Cost of Variability Traditional View Taguchi’s View OM&PM/Class 7b
Class 7b: Key Learning Objectives • Elements of TQM / Baldridge / ISO 9000 • Costs of Quality • Components of Quality • Voice of the Customer • Linking business processes to customer needs • Product Design Methodologies: • Convert customer needs to product and process specifications: QFD • Value Engineering OM&PM/Class 7b