Download
1 / 14
170 likes | 421 Vues
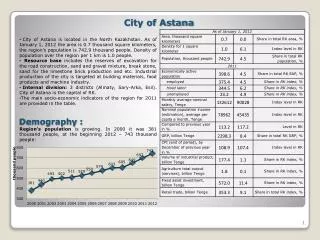
City of Astana. City of Astana is located in the North Kazakhstan. As of January 1, 2012 the area is 0 . 7 thousand square kilometers, the region's population is 742 . 9 thousand people . Density of population over the region per 1 km is 1 . 0 people .

E N D
City of Astana • City of Astana is located in the North Kazakhstan.As of January 1, 2012 the area is 0.7 thousand square kilometers, the region's populationis 742.9 thousand people. Density of population over the region per 1 km is 1.0 people. • Resource baseincludes the reservesof excavation for the road construction, sand and gravel mixture, break stone, sand for thelimestone brick productionand etc. Industrial production of the city is targeted atbuilding materials, food products and machine industry. • Internal division: 3 districts (Almaty, Sary-Arka, Esil). City of Astana is the capital of RK. • The main socio-economic indicators of the region for 2011 are provided in the table. Demography : Region’s population is growing. In 2000 it was 381 thousand people, at the beginning 2012– 743 thousand people: 1
Economically active population (EAP) • The number of employed population increases and unemployed population falls in both absolute and relative terms. For 10 years, from 2001 to 2011, the employed population has increased from 91 to 94%, while the number of unemployed people has fallen from9to 6%. • Characteristic feature of the employed population dynamics is the growth of hired labor and the reduction of self-employed people. From 2001 to 2011 the number of hired labor has increased from 83% to 92%, the number of self-employed people has fallen from 17 to 8%. EAP structure corresponds to the average in Kazakhstan: EAP of the region is increasing at a moderate pace and in 2011 it reached 398.6 thousand people. 375.4 thousand people are employed, 23.2 thousand peopleare unemployed. Economically inactive population made up 149.4 thousand people, it is above the level in 2000:
The changes of employed population structure are supported by a strong tendency of unemployment rate reduction from 12.5% in 2000 to5.8% in 2011 and growth of the economic activity of the population: • In 2011 unemployment rate in Astana was above the average in Kazakhstan – 5.4%: Unemployment Level
Quality of Life • Cost of living has been growing steadily since 2003, and the values are above the average in RK: • Life expectancy at birth in the region is increasing and the values are above the average in Kazakhstan: • Some of life quality indicators in 2011: • Share of population with income used for consumption below the poverty line is decreasingand it is below the average in Kazakhstan in 2011:
Enrollment • Enrollment share of the population aged 6-24 years has increased since 2001,however, its values are below the average in RK: • The number of children in regular preschools has increased since 2001: • The number of students in technical and vocational education is growing: • The number of students in higher educationhas been growing at a moderate pace:
Monthly average nominal salary per employee in Astana for 2011 is 132,612 Tenge, that is above the country’s average – 90,028 Tenge: • In the dynamics the average nominal salary per employee and the average nominal income per capita are ever-growing. • The index of the nominal and real incomes showed a decline during the crisisin 2008-2010. In 2010 the growth of nominal income was less than the consumer price index, i.e. revenue growth did not cover inflation: Population Income
GRP growth in 2011 doesn’t exceed the average growth of total GRP of all the regions of Kazakhstanand makes up 117.9% compared to 2010, against the total value of RK - 126.4%: • GRP ofAstana and the city’s share in total GRP of all the regions has increased since 2000: Economy
Fixed assets investment tends to a stable significant growth, however, its values have decreased during the crisis in 2009 and 2010: • The growth of fixed assets investment in 2011 has greatly exceeded the total average levelof RK regions and made up 144.3% compared to previous yearagainst 107.7% in general in RK: • The share of fixed assets investment in the Kazakhstan’s level of investment has increased from 9.9% in 2000 to 11.4% in 2011: Investment
The volume of production in agriculture was increasing until 2005, decreased significantly in 2006 from 4.8 to 0.7 billion Tenge. In 2011 the value was 1.3 billion Tenge: • The share of the region’s volume of production in agriculture in total Kazakhstan’s volume of industry’s production. In 2010 0.1% of country’s agricultural production was manufactured in the region: Agriculture
The growth of industrial production volumes was observed throughout the study period, excluding crisis years 2008-2009,when manufacturing volumes showed the decrease: • Real sector industries with the highest values of production in 2010 are construction, production of other non-metal mineral products,production and distribution of electricity, machine industry, production of finished metal products, production of rubber and plastic goods.These industries have the significant share in the total production volume of RK andregion’s GRP: • The share of industrial production in the Kazakhstan’s level has increased slightly since 2000: Real Sector
Sector Enterprises • The number of industrial enterprisesdecreased from 2000 to 2008. The last decrease was observed during the crisis since2008: • The number of construction companieswas increasing up to 2008,thereafter it fell down during the economic crisis: • The number of working agricultural enterpriseshas decreased from the maximum of 2003 (81) to 29 in 2011:
Small and Medium Business • The number of registered legal entities as of October 1, 2012 is 35798. The SME number is 35558. The structure of the enterprises number is close to the RK average level: • SME share of the region's GRP is growing at a moderate pace and it is above the average level in RK:
Interbudgetary Relations • Budget revenues of the city of Astana in 2011 amounted to 340.4 trillion Tenge, including 244.7 trillion Tenge of transfers from the national budget. Expenses amounted to 337 trillion Tenge, including to 2.8 trillion Tenge of transfers to the national budget. Thus, the region is subventional:
Main target indicators: • GRP shall be 1775,9 billion Tenge in 2015; • An increase of GRP in real termsby29% in 2015, compared to 2009; • The inflation rate in 2011-2015 shall be held at 6 - 8% per year (2009 - 6.5%); • An increase of the labor productivity in the manufacturing industry by 1.7 times in 2015 compared to 2009 • An increase of GVA of the light industry to 366.4 million Tenge in 2015 • An increase of the labor productivity in the light industry up to 5 million Tenge per person employed in the industry; • An increase of GVA of the machine industry to 14,700 million Tenge; • An increase of GVA of the metallurgical industry to 12,148.1 million Tenge; • An increase of the labor productivity of steel industry to 40.7 million Tenge; • An increase of the export of steel products by 2015 by 2 times; • An increase of GVA of the construction industry by 2015 to no less than 133.7%; • An increase of the labor productivity in the production of construction materials in 2015 to 65.5 thousand U.S. dollars; • The proportion of the local content in the procurement of government agencies and organizations, strategic companies – for procurement of goods to 62%; • Industrial output in the industrial park shall be 4,0 billion Tenge; • Labor productivity in the agricultural sector shall be 1141.0 thousand Tenge; • The share of SMEs in GRP in 2015 shall be 35.3%; • Reduction of the operating costs of registering and doing business by 2011 to 30%, by 2015 - 30%; • Coverage of preschool education in 2015 shall reach 69%; • Life expectancy of the population shall be 76 years; • Total mortality per 1000 population shall be 4.35%; • The unemployment rate in 2015 shall be 5.5%; • The share of the population with income below the minimum cost of living shall be 3.2%; • Energy intensity of GRP shall decrease to 11%; • 100% provision with information about the land and subjects of land property relations on requests; • Index of air pollution in 2015 shall be 6.0 units. (2009 - 4.67 units.) • Pollution index of surface water in 2015 will be 2.09 units. (2009 - 2.14 units). Development Program for AstanaCity for 2011-2015