Download
1 / 24
240 likes | 393 Vues
U.S. INFLUENCE ON TROPOSPHERIC OZONE AND THE EFFECTS OF RECENT EMISSION REDUCTIONS. Modeling: Rynda Hudman *, Lee Murray, Daniel Jacob, Solene Turquety, Dylan Millet, Shiliang Wu NEI 99 Emissions: Alice Gilliland

E N D
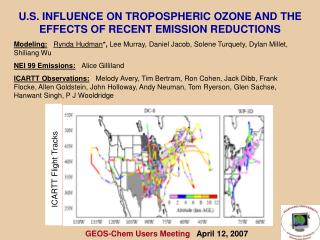
U.S. INFLUENCE ON TROPOSPHERIC OZONE AND THE EFFECTS OF RECENT EMISSION REDUCTIONS Modeling:Rynda Hudman*, Lee Murray, Daniel Jacob, Solene Turquety, Dylan Millet, Shiliang Wu NEI 99 Emissions:Alice Gilliland ICARTT Observations:Melody Avery, Tim Bertram, Ron Cohen, Jack Dibb, Frank Flocke, Allen Goldstein, John Holloway, Andy Neuman, Tom Ryerson, Glen Sachse, Hanwant Singh, P J Wooldridge ICARTT Flight Tracks GEOS-Chem Users Meeting April 12, 2007
ICARTT CONSTRAINTS ON SUMMERTIME EMISSIONS & HEMISPHERIC OZONE Alt (km) BBNA FFLightning 10 NOx/flash 4X larger than previously assumed! 8 6 Export well constrained 4 2 NOx stationary sources 50% effects on O3 & OPE Northern Hemisphere Burden Anthropogenic CO 60% O3 (ppbv) Europe North America
Flash counts (flashes/km2/s) GEOS-CHEM SIMULATION (v7.02.04 w/ modifications below) Modifications from ICARTT constraints in blue (improved) NOx Lightning Emissions Lightning X4 over U.S. & distributed to tropopause [Price and Rind, 1992] NOx emission EPA National Emissions Inventory 1999 v1 (w/ modifications to VOCs) Power plant and Industry NOx 50% Anthropogenic CO 60% CO emissions May-August 2004 NA Fire Inventory [Turquety et. al, 2007]
GEOS-CHEM VS. ICARTT Mean comparison along the flight tracks Ozone FT bias 5-10 ppbv Large UT NOx bias BL bias in CO and NOx Measurements (WP-3D, DC-8): CO (J. Holloway, G. Sachse), NOx (T. Ryerson, R. Cohen, W. Brune), PAN (F. Flocke, H. Singh), HNO3 (A. Neuman, J. Dibb), ozone (T. Ryerson, M. Avery)
ICARTT OBSERVATIONS CONFIRM LARGE DECREASE SINCE 1999 IN INDUSTRY/POWER SOURCE Large overestimate powerplant/industry dominated Midwest and in the South Median Model / Observed NOx (0-2 km) DC-8 Midwest Median NO2 Observed Simulated Improved Simulation [ratio] 50% reduction in power and industry source as determined by Frost et al., [2006] improves boundary layer NO2 simulation NO2 (ppbv) Measurements (WP-3D, DC-8):T. Ryerson (NO2), Ron Cohen/Tim Bertram (NO2)
OZONE REDUCTIONS RESULTING FROM DECREASE IN NOx EMISSIONS Regional differences in ozone, can be explained by OPE: OPE Midwest: 2.5-3.5 Southeast: 4-5.5 Can we see changes in OPE due NOx emission reductions in dO3/dCO in U.S. outflow? Requires good estimate of CO source…..
BOTH AIRCRAFT AND SURFACE DATA SUGGEST NEI 99 CO EMISSIONS ARE 2.5 TIMES TOO HIGH SIMULATED (anthro CO reduced by 60%) SIMULATED (NEI99) OBSERVED Measurments: J. Holloway, G. Sachse Aircraft (0-1.5 km) Measurments: A. Goldstein/ Dylan Millet Chebogue Point (surface) Hudman et al. [2007b]
SCATTERPLOT OF SIMULATED TO OBSERVED CO Parrish [2006] finds on-road source overestimated by 50% in NEI 99 (~33% reduction in NEI source due to this bias) CO decrease trend 3.7% yr-1 (1987-2002), ( 12% reduction in anthropogenic CO source since 1999 due to trend) From these estimates 2004 emissions 45% lower than NEI 99 (Our estimate 60%)
ANTHROPOGENIC CO SOURCE IN THE UNITED STATES IN SUMMER IS NOW LOWER THAN BIOGENIC SOURCE NEI 99 NEI 99 with 60% reduction in CO SOURCE TYPE (Tg CO) CO ANTHROPOGENIC EMISSION (11.5, 4.6) CO SOURCE FROM ANTHROPOGENIC VOC OXIDATION (1.8, 1.8) CO SOURCE FROM ISOPRENE OXIDATION (6.7, 6.7) CO SOURCE FROM OTHER BIOGENIC OXIDATION (2.4, 2.4) CO SOURCE FROM OTHER BIOMASS BURNING OVER CONTINENTAL U.S.(0.16, 0.16) Note: Fires in Canada and Alaska ~19 Tg CO
OZONE-CO CORRELATIONS SHOW DECADAL INCREASE Chebogue Point Aircraft (0-1.5 km, 11-5pm LT) ALL WIND DIRECTIONS WINDS FROM W-SE Overestimate of tropical background Obs during the early 90s show dO3/dCO ~ 0.3 – 0.4 [Chin et al., 1994; Parrish et al., 1998]. Change consistent with decadal changes in emissions and OPE over the Northeaster United States
SUMMERTIME NORTH AMERICAN OZONE ENHANCEMENTS ICARTT DC-8 ~ Equal contributions for lightning and anthropogenic emissions in free troposphere and to NH burden NA Enhancement to Hemispheric Ozone Biomass Lightning Anthropogenic Simulated Observed All
OBSERVED dO3/dCO INCREASE OVER THE PAST DECADE CONSISTENT WITH UNDERSTANDING OF OPE AND SOURCES dO3/dCO OPE (dO3/dNOx) * NOx/CO source ratio (dNOx/dCO) Consider NE U.S., July 1 – August 15, 2004 (With ICARTT Constraints) Anthro = 1.2 Tg CO, 0.10 Tg N Biogenic = 0.87 Tg CO July 1 – August 1994 4.9% anthro decrease/year in urban air [Parrish, 2006] Total CO 26% higher 22% stationary NOx reduction [Hudman et al., 2007] Anthro NOx 15% higher OPE lower by ~9% NOx/CO source ratio lower by ~19% ~28% increase in dO3/dCO expected 0.3-0.4 (90s) 0.4-0.5 (present) Multiply dO3/dCO * ECO 1.5 Gmol ozone d-1 (Ozone flux consistent with 1990s estimates)
EVALUATION OF EPA NEI99 ON-ROAD TRANSPORT EMISSIONS On-road CO emissions too high by 50% On-Road transport inventories (1995) On-road emission estimates Fuel - based inventory + CO & CO/NOx ambient trends inferred emissions [Parrish et al., 2006] *Note: 2004 trends report is same as NEI99
UNITED STATES NOx REGULATIONS AIMED AT REDUCING OZONE SMOG 1998 1999 2000 2001 2002 2003 2004 2005 2006 2007 2008 50% NOx PP reduction Frost et al., [2006] NOx SIP SIP Phase 1 CAIR SIP Phase 2 • 1998 - The EPA NOx SIP Call mandated that 22 eastern states & DC revise their SIPs to meet NOx emissions reductions by 2003 (Phase 1) and further reduction by 2007 (Phase 2). • 2003 - All 22 states reduced NOx point source emissions to their Phase 1 levels. • 2004 - Frost et al., [2006] determined that as a result emission rates of power plant NOx have decreased approximately 50% between 1999 and 2003. • 2005 - NOx levels in the U.S. will likely continue to drop. In March 2005, the EPA issued the Clean Air Interstate Rule, which will, permanently reduce NOx emissions to 60% of 2003 levels in 25 eastern states, and the DC.
CO OVERESTIMATE IS NOT CAUSED BY INSUFFICIENT VENTILATION OR BIOGENIC SOURCE Boundary layer ventilation is constrained by vertical profile of short-lived VOCs Biogenic VOCs are well-constrained by successful simulation of formaldehyde Propane: E. Atlas CH2O: Alan Fried
CHEBOGUE POINT CO TIMESERIES Bias still exists during outflow events 7/1 8/1 [Provided by D. Millet]
UT NOx OBSERVATIONS POINT TO A LARGER THAN EXPECTED LIGHTNING NOx SOURCE NOx (8-12 km) Observed GEOS-Chem (Lightning X4) [ppbv] DOESN’T APPEAR TO BE A NOx LIFETIME ISSUE Hudman et al. [2007a] NO: W. Brune, NO2: R. Cohen/T Bertram
FLASH RATES WELL SIMULATED POINTING TO A LARGER YIELD/FLASH AT NORTHERN MIDLATITUDES Lightning parameterization (flashes/km2/s): Land : ~CTH4.9 , Ocean: ~CTH1.73 CTH= Cloud Top Height Price and Rind [1992] Flash Comparison GEOS-Chem GEOS-Chem Vertical Distribution Pickering et al.,[1998] [Flashes km2 s] NLDN
PEAK CURRENT AS A FUNCTION OF LATITUDE [Huntrieser et al., 2005]
NO PRODUCTION RATE CALCULATED FROMR RECENT CAMPAIGNS Standard GEOS-Chem mean flash rate was 125 mol flash-1 (Improved X4 500 mol flash-1) [Ken Pickering]
OZONE COMPARISON INTEX-NA SOUTHEAST U.S.Increase in lightning yield X4 to 500 mol/flash has ~10 ppbv effect on ozone O3 NO2 2004 was not an anomalous lightning year Observed Simulated Improved Simulation Hudman et al. [2007a] …suggests great sensitivity of ozone to climate change
NORTH AMERICAN ENHANCEMENT TO HEMISPHERIC OZONE Hudman et al. [2007b]