Download
1 / 182
1.82k likes | 1.87k Vues
Learn about functions, domains, ranges, and mathematical modeling with detailed examples and practical applications.

E N D
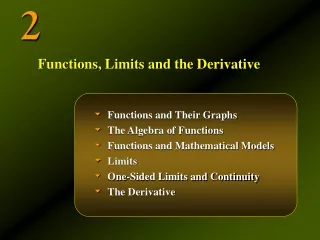
Functions and Their Graphs The Algebra of Functions Functions and Mathematical Models Limits One-Sided Limits and Continuity The Derivative 2 Functions, Limits and the Derivative
2.1 Functions and Their Graphs
Functions • Function: A function is a rule that assigns to each element in a set Aone and only one element in a set B. • The set A is called the domain of the function. • It is customary to denote a function by a letter of the alphabet, such as the letter f.
Functions • The element in B that f associates with x is written f(x) and is called the value of f at x. • The set of all the possible values of f(x) resulting from all the possible values of xin its domain, is called the range of f(x). • The output f(x) associated with an input x is unique: • Eachxmust correspond to one and onlyone value of f(x).
Example • Let the function fbe defined by the rule • Find: f(1) • Solution: Example 1, page 51
Example • Let the function fbe defined by the rule • Find: f(–2) • Solution: Example 1, page 51
Example • Let the function fbe defined by the rule • Find: f(a) • Solution: Example 1, page 51
Example • Let the function fbe defined by the rule • Find: f(a + h) • Solution: Example 1, page 51
Applied Example • ThermoMaster manufactures an indoor-outdoor thermometer at its Mexican subsidiary. • Management estimates that the profit (in dollars) realizable by ThermoMaster in the manufacture and sale of x thermometers per week is • Find ThermoMaster’s weekly profit if its level of production is: • 1000 thermometers per week. • 2000 thermometers per week. Applied Example 2, page 51
Applied Example Solution • We have • The weekly profit by producing1000 thermometers is or $2,000. • The weekly profit by producing2000 thermometers is or $7,000. Applied Example 2, page 51
Determining the Domain of a Function • Suppose we are given the function y = f(x). • Then, the variable x is called the independent variable. • The variable y, whose value depends on x, is called the dependent variable. • To determine the domain of a function, we need to find what restrictions, if any, are to be placed on the independent variable x. • In many practical problems, the domain of a function is dictated by the nature of the problem.
Applied Example: Packaging • An open box is to be made from a rectangular piece of cardboard 16 inches wide by cutting away identical squares (x inches by x inches) from each corner and folding up the resulting flaps. x 10 10 – 2x x x 16 – 2x x 16 Applied Example 3, page 52
Applied Example: Packaging • An open box is to be made from a rectangular piece of cardboard 16 inches wide by cutting away identical squares (x inches by x inches) from each corner and folding up the resulting flaps. • Find the expression that gives the volumeV of the box as a function of x. • What is the domain of the function? • The dimensions of the resulting box are: x 10 – 2x 16 – 2x Applied Example 3, page 52
Applied Example: Packaging Solution a. The volume of the box is given by multiplying its dimensions(length ☓ width ☓ height), so: x 10 – 2x 16 – 2x Applied Example 3, page 52
Applied Example: Packaging Solution b. Since the length of each side of the box must be greater than or equal to zero, we see that must be satisfied simultaneously. Simplified: All three are satisfied simultaneously provided that: Thus, the domain of the function f is the interval [0, 5]. Applied Example 3, page 52
More Examples • Find the domain of the function: Solution • Since the square root of a negative number is undefined, it is necessary that x – 1 0. • Thus the domain of the function is [1,). Example 4, page 52
More Examples • Find the domain of the function: Solution • Our only constraint is that you cannot divide by zero, so • Which means that • Or more specifically x ≠–2 and x ≠ 2. • Thus the domain of f consists of the intervals (–, –2), (–2, 2), (2, ). Example 4, page 52
More Examples • Find the domain of the function: Solution • Here, any real number satisfies the equation, so the domain of f is the set of all real numbers. Example 4, page 52
Graphs of Functions • If f is a function with domain A, then corresponding to each real number x in A there is precisely one real number f(x). • Thus, a function f with domain A can also be defined as the set of all ordered pairs(x, f(x)) where x belongs to A. • The graph of a functionf is the set of all points (x, y) in the xy-plane such that x is the domain of f and y = f(x).
Example • The graph of a function f is shown below: y y (x, y) Range x x Domain Example 5, page 53
Example • The graph of a function f is shown below: • What is the value of f(2)? y 4 3 2 1 –1 –2 x 1 2 3 4 5 6 7 8 (2,–2) Example 5, page 53
Example • The graph of a function f is shown below: • What is the value of f(5)? y 4 3 2 1 –1 –2 (5,3) x 1 2 3 4 5 6 7 8 Example 5, page 53
Example • The graph of a function f is shown below: • What is the domain of f(x)? y 4 3 2 1 –1 –2 x 1 2 3 4 5 6 7 8 Domain: [1,8] Example 5, page 53
Example • The graph of a function f is shown below: • What is the range of f(x)? y 4 3 2 1 –1 –2 Range: [–2,4] x 1 2 3 4 5 6 7 8 Example 5, page 53
Example: Sketching a Graph • Sketch the graph of the function defined by the equation y = x2 + 1 Solution • The domain of the function is the set of all real numbers. • Assign several values to the variable x and compute the corresponding values for y: Example 6, page 54
Example: Sketching a Graph • Sketch the graph of the function defined by the equation y = x2 + 1 Solution • The domain of the function is the set of all real numbers. • Then plot these values in a graph: y 10 8 6 4 2 x – 3 – 2 – 1 1 2 3 Example 6, page 54
Example: Sketching a Graph • Sketch the graph of the function defined by the equation y = x2 + 1 Solution • The domain of the function is the set of all real numbers. • And finally, connect the dots: y 10 8 6 4 2 x – 3 – 2 – 1 1 2 3 Example 6, page 54
Example: Sketching a Graph • Sketch the graph of the function defined by the equation Solution • The function f is defined in a piecewise fashion on the set of all real numbers. • In the subdomain(–, 0), the rule for f is given by • In the subdomain[0, ), the rule for f is given by Example 7, page 55
Example: Sketching a Graph • Sketch the graph of the function defined by the equation Solution • Substituting negative values for x into , while substituting zero and positive values into we get: Example 7, page 55
Example: Sketching a Graph • Sketch the graph of the function defined by the equation Solution • Plotting these data and graphing we get: y 3 2 1 x – 3 – 2 – 1 1 2 3 Example 7, page 55
2.2 The Algebra of Functions
The Sum, Difference, Product and Quotient of Functions • Consider the graph below: • R(t) denotes the federal government revenue at any time t. • S(t) denotes the federal government spending at any time t. y 2000 1800 1600 1400 1200 1000 y = R(t) y = S(t) S(t) Billions of Dollars R(t) t 1990 1992 1994 1996 1998 2000 t Year
The Sum, Difference, Product and Quotient of Functions • Consider the graph below: • The difference R(t) – S(t) gives the budget deficit(if negative) or surplus(if positive) in billions of dollars at any time t. y 2000 1800 1600 1400 1200 1000 y = R(t) y = S(t) S(t) Billions of Dollars D(t) = R(t) – S(t) R(t) t 1990 1992 1994 1996 1998 2000 t Year
The Sum, Difference, Product and Quotient of Functions • The budget balance D(t) is shown below: • D(t) is also a function that denotes the federal government deficit (surplus) at any time t. • This function is the difference of the two function R and S. • D(t) has the same domain asR(t) and S(t). y 400 200 0 –200 –400 y = D(t) t Billions of Dollars t 1992 1994 1996 1998 2000 D(t) Year
The Sum, Difference, Product and Quotient of Functions • Most functions are built up from other, generally simpler functions. • For example, we may view the function f(x) = 2x + 4 as the sum of the two functions g(x) = 2x and h(x) = 4.
The Sum, Difference, Product and Quotient of Functions • Let f and g be functions with domains A and B, respectively. • The sumf + g, the differencef – g, and the productfg of f and g are functions with domain A ∩ Band rule given by (f + g)(x) = f(x) + g(x)Sum (f–g)(x) = f(x) –g(x)Difference (fg)(x) = f(x)g(x) Product • The quotientf/g of f and g has domain A ∩ Bexcluding all numbers x such that g(x)= 0 and rule given by Quotient
Example • Let and g(x) = 2x + 1. • Find the sums, the differenced, the productp, and the quotientq of the functions f and g. Solution • Since the domain of f is A = [–1,) and the domain of g is B = (– , ), we see that the domain of s, d, and p is A ∩ B= [–1,). • The rules are as follows: Example 1, page 68
Example • Let and g(x) = 2x + 1. • Find the sums, the differenced, the productp, and the quotientq of the functions f and g. Solution • The domain of the quotient function is [–1,) together with the restriction x≠–½. • Thus, the domain is [–1, –½) U (–½,). • The rule is as follows: Example 1, page 68
Applied Example • Suppose Puritron, a manufacturer of water filters, has a monthly fixed cost of $10,000 and a variable cost of –0.0001x2 + 10x (0 x 40,000) dollars, where x denotes the number of filters manufactured per month. • Find a function C that gives the total monthly cost incurred by Puritron in the manufacture of x filters. Applied Example 2, page 68
Applied Example Solution • Puritron’s monthly fixed cost is always $10,000, so it can be described by the constant function: F(x) = 10,000 • The variable cost can be described by the function: V(x) = –0.0001x2 + 10x • The total cost is the sum of the fixed cost F and the variable cost V: C(x) = V(x) + F(x) = –0.0001x2 + 10x + 10,000 (0 x 40,000) Applied Example 2, page 68
Applied Example Lets now consider profits • Suppose that the total revenueR realized by Puritron from the sale of x water filters is given by R(x) = –0.0005x2 + 20x (0 ≤x≤ 40,000) • Find • The total profit function for Puritron. • The total profit when Puritron produces 10,000 filters per month. Applied Example 3, page 69
Applied Example Solution • The totalprofitP realized by the firm is the difference between the total revenueR and the total costC: P(x) = R(x) – C(x) = (–0.0005x2 + 20x)– (–0.0001x2 + 10x + 10,000) = –0.0004x2 + 10x – 10,000 • The totalprofit realized by Puritron when producing10,000 filters per month is P(x) = –0.0004(10,000)2 + 10(10,000)– 10,000 = 50,000 or $50,000 per month. Applied Example 3, page 69
The Composition of Two Functions • Another way to build a function from other functions is through a process known as the composition of functions. • Consider the functions f and g: • Evaluating the function gat the pointf(x), we find that: • This is an entirely new function, which we could call h:
The Composition of Two Functions • Let f and g be functions. • Then the composition of g and f is the function ggf(read “gcirclef ”) defined by (ggf)(x) = g(f(x)) • The domain of ggfis the set of all x in the domain of f such that f(x) lies in the domain of g.
Example • Let • Find: • The rule for the composite function ggf. • The rule for the composite function fgg. Solution • To find ggf, evaluate the function g at f(x): • To find fgg, evaluate the function f at g(x): Example 4, page 70
Applied Example • An environmental impact study conducted for the city of Oxnard indicates that, under existing environmental protection laws, the level of carbon monoxide (CO) present in the air due to pollution from automobile exhaust will be 0.01x2/3 parts per million when the number ofmotor vehiclesisx thousand. • A separate study conducted by a state government agency estimates that t years from now the number of motor vehicles in Oxnard will be 0.2t2 + 4t + 64 thousand. • Find: • An expression for the concentration of CO in the air due to automobile exhaust t years from now. • The level of concentration 5years from now. Applied Example 5, page 70
Applied Example Solution • Part (a): • The level of CO is described by the function g(x) =0.01x2/3 where x is the number (in thousands) of motor vehicles. • In turn, the number (in thousands) of motor vehicles is described by the function f(x) = 0.2t2 + 4t + 64 where t is the number of years from now. • Therefore, the concentration of CO due to automobile exhaust t years from now is given by (ggf)(t) = g(f(t)) = 0.01(0.2t2 + 4t + 64)2/3 Applied Example 5, page 70
Applied Example Solution • Part (b): • The level of CO five years from now is: (ggf)(5) = g(f(5)) = 0.01[0.2(5)2 + 4(5) + 64]2/3 = (0.01)892/3≈ 0.20 or approximately 0.20 parts per million. Applied Example 5, page 70
2.3 Functions and Mathematical Models
Mathematical Models • As we have seen, mathematics can be used to solve real-world problems. • We will now discuss a few more examples of real-world phenomena, such as: • The solvency of the U.S. Social Security trust fund (p.79) • Global warming (p. 78)