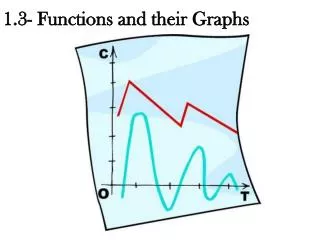
Functions and Their Graphs
Functions and Their Graphs. Formula: y = x y = x ² y = x³ y = √x y = |x| . Graph: Linear— “line” Quadratic— “parabola” Cubic— “squiggly” Square Root– “half of a parabola Absolute Value– “V-shaped”. 5 basic graphs. Shifts y = a(x - h) ² +k.


Functions and Their Graphs
E N D
Presentation Transcript
Formula: y = x y = x² y = x³ y = √x y = |x| Graph: Linear— “line” Quadratic— “parabola” Cubic— “squiggly” Square Root– “half of a parabola Absolute Value– “V-shaped” 5 basic graphs
Shiftsy = a(x - h)²+k • h is the horizontal shift. The graph will move in the opposite direction. • K is the vertical shift. The graph will move in the same direction. • If a is positive, then the graph will go up. • If a is negative, then the graph will go down.
If a is positive, then the graph will go up. • If a is negative, then the graph will go down.
The Vertex of a Parabolay = a(x – h)² + k • The vertex is (h, k). • In other words, the vertex is (H.S., V.S). • For example, y = (x – 2)² – 9. • H.S. = Right 2 • V.S. = Down 9 • Therefore, the vertex is denoted by V(2, -9).
For example: y = x² + 6 • y = (x – 0)² + 6, so the V.S. is up 6 and the H.S. is none. Therefore, the vertex is V (0, 6). • Since a is positive, the direction of the parabola is up. • Since a is 1, then the parabola is neither fat or skinny. It is a standard parabola.
Another example: y = 2(x + 2)² + 6 • H.S. = left 2 • V.S. = up 6 V (–2, 6) • Direction is up • Since a = 2, then the parabola is skinny
Axis of Symmetry of a Parabolay = a(x – h)² + k • x = H.S. or x = h • For example, y = (x – 2)² • Axis of symmetry is x = 2
Practice • up or down? • fat or skinny? • V.S.? • H.S.? • Axis Symmetry: • Graph it
Practicey = -|x – 6| + 3 • What does this graph look like? • Horizontal shift? • Vertical shift? • Vertex? • Fat or skinny? • Up or down?
Practicey = (x + 1)³ - 5 • What does this graph look like? • H.S.? • V.S.? • There is no vertex. • Right or Left? • Fat or skinny?
Practice • What does this graph look like? • H.S.? • V.S.? • There is no vertex. • Up or down? • Fat or skinny?
Domain and Range • Domain is the set of all x-values. You will look at the graph from left to right (like you’re reading a book). Ask yourself: where does the graph begin? Where does it end? • Range is the set of all y-values. You will look at the graph from bottom to top. Ask yourself: where does the graph begin? Where does it end?
Find the domain and range. • From left to right, while following the x-axis, where does the graph begin? Where does it end? • From bottom to top, while following the y-axis, where does the graph begin? Where does it end?