Logarithmic Functions and Their Graphs
Logarithmic Functions and Their Graphs. Section 6.2. Our first question. What is a logarithm ?. A logarithm is just an exponent. Definition. Let b > 0, and b ≠ 1, x = b y if and only if log b x = y for x > 0 and for every real number y . . Example.


Logarithmic Functions and Their Graphs
E N D
Presentation Transcript
Logarithmic Functions and Their Graphs Section 6.2
Our first question What is a logarithm ? A logarithm is just an exponent.
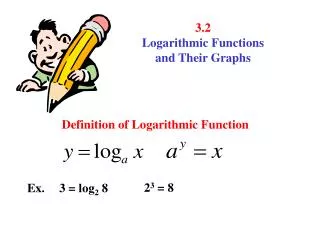
Definition • Let b > 0, and b ≠ 1, x = by if and only if logbx = y for x > 0 and for every real number y.
Example • Rewrite in logarithmic form. • 64 = 43 • 73 = x
Example • Rewrite in exponential form • log416 = 2 • n=logmx
Basic Properties of Logarithms • For b > 0, and b ≠ 1 • Logb1 = 0 • Logbb = 1 • Logbbx= x
Example • Simplify
Example • Evaluate • log216 • log51 • log2(1/4) • log10(0.1)
Definition • A base 10 logarithm is known as the common logarithm. We denote log10x = log x
Example 5 – Page 494 • Evaluate • log 10000 • log(1/1000) • log 512 • log(-10)
Definition • Let x > 0, b > 0, and b ≠ 1. The inverse function of f (x) = bxis called the logarithmic function with base b, and is denoted by f -1(x) = logbx. y = logbxis equivalent to by = x • Since x > 0 the domain of f -1(x) = logbxis the set of all positive real numbers.
Example 6 – Page 495Find the inverse function of each exponential function. Your Turn!
Example 8 – Page 496 • Graph y = log2x by hand.
Graphs of Logarithmic Functions , where b > 0 and b ≠ 1. • Domain: (0, ∞) • Range: (-∞, ∞) • x-intercept is (1,0) • No y-intercept • The y-axis is a vertical asymptote (x = 0). • f is 1-1 (one-to-one) • Graph passes through the point (b, 1) • If b > 1, the function is increasing. • If 0 < b < 1, the function is decreasing.
Example • Graph y = 10x and y = log x your graphing calculator using the window [-4, 12, 2] x [-4, 12, 2]. • If no graphing calculator: • Make a table of values for each function. • Graph both functions by hand.
Graph of a Logarithmic Function Note that the graph of y = log (x) is the graph of y = 10xreflected through the line y = x. These are inverse functions.
Example 10 – Page 500 . • State the transformation of each function, and if increasing or decreasing. Shift Up 3 Increasing y = logx + 3 y = log(x-4) + 1 Right 4, up 1 Increasing Reflect on x-axis, shift down 2 Decreasing y = -logx - 2
Example 11 – Page 501 Find the domain of each function algebraically. (-17, ∞ ) (-∞, 5 ) (-∞, 0) u (0, ∞)