Download
1 / 14
180 likes | 333 Vues
This lesson covers the definition and properties of exponential functions, focusing on the general form (f(x) = a^x) where (a > 0) and (a <br>eq 1). We explore examples including (f(x) = 3^x) and (g(x) = 0.5^x), demonstrating how to calculate specific values and sketch their graphs. The lesson includes discussions on horizontal asymptotes, domain, and range, as well as transformations like vertical translations and reflections. We also introduce the natural base (e) and its significance in growth and decay applications, particularly in compound interest calculations.

E N D
Digital Lesson Exponential Functions and Their Graphs
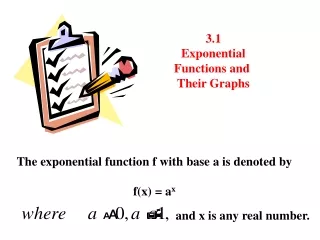
Definition of Exponential Function The exponential function f with base a is defined by f(x) = ax where a > 0, a 1, and x is any real number. For instance, f(x) = 3x and g(x) = 0.5x are exponential functions.
The value of f(x) = 3x when x = 2 is f(2) = 32= 9 The value of f(x) = 3x when x = –2 is f(–2) = 3–2 = The value of g(x) = 0.5x when x = 4 is g(4) = 0.54= 0.0625
The graph off(x) = ax, a > 1 Graph of Exponential Function (a > 1) y 4 Range: (0, ) (0, 1) x 4 Horizontal Asymptote y = 0 Domain: (–, )
The graph off(x) = ax, 0 < a < 1 Graph of Exponential Function (0 < a < 1) y 4 Range: (0, ) Horizontal Asymptote y = 0 (0, 1) x 4 Domain: (–, )
Example: Sketch the graph off(x) = 2x. Example: Graph f(x) = 2x y 4 2 x –2 2
Example: Sketch the graph ofg(x) = 2x – 1. State the domain and range. Example: Translation of Graph y f(x) = 2x The graph of this function is a vertical translation of the graph of f(x) = 2x downone unit . 4 2 Domain: (–, ) x y = –1 Range: (–1, )
Example: Sketch the graph ofg(x) = 2-x. State the domain and range. Example: Reflection of Graph y f(x) = 2x The graph of this function is a reflection the graph of f(x) = 2x in the y-axis. 4 Domain: (–, ) x –2 2 Range: (0, )
Example: Sketch the graph ofg(x) = 4x-3 + 3. State the domain and range. Example: Reflection of Graph y Make a table. x y 4 1 3.0625 2 3.25 3 4 x 4 7 –2 2 5 19 Domain: (–, ) Range: (3, ) or y > 3
The Natural Base e The number e The irrational number e, where e 2.718281828… is used in applications involving growth and decay. Using techniques of calculus, it can be shown that
The graph off(x) = ex Graph of Natural Exponential Function f(x) = ex y 6 4 2 x –2 2
Example: Sketch the graph ofg(x) = ex-5 + 2. State the domain and range. y Make a table. x y 4 7 9.39 6 4.72 5 3 x 4 2.36 –2 2 3 2.14 Domain: (–, ) Range: (2, ) or y > 2
Interest Applications Formulas for Compound Interest— 1.) compound per year -- A = P 1 + r nt n r is the rate n is the number times you compound your money per year t is time. Balance in account Principal ($ you invest) 2. Compounded continuously– A = Pert
A total of $12000 is invested at an annual interest rate of 9%. Find the balance after 5 years if it is compoundeda. quarterlyb. monthlyc. continuously