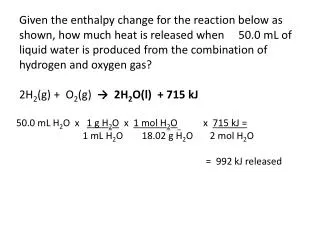
Download
1 / 26
260 likes | 454 Vues
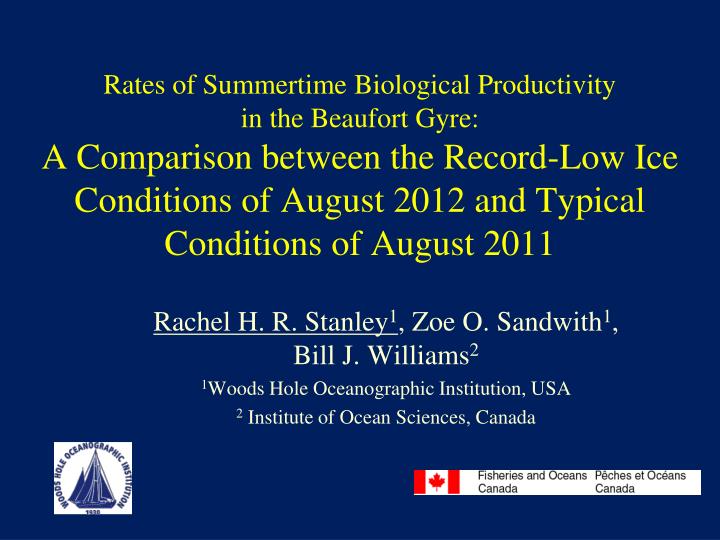
Rates of Summertime Biological Productivity in the Beaufort Gyre: A Comparison between the Record-Low Ice Conditions of August 2012 and Typical Conditions of August 2011. Rachel H. R. Stanley 1 , Zoe O. Sandwith 1 , Bill J. Williams 2 1 Woods Hole Oceanographic Institution, USA

E N D
Rates of Summertime Biological Productivity in the Beaufort Gyre: A Comparison between the Record-Low Ice Conditions of August 2012 and Typical Conditions of August 2011 Rachel H. R. Stanley1, Zoe O. Sandwith1, Bill J. Williams2 1Woods Hole Oceanographic Institution, USA 2 Institute of Ocean Sciences, Canada
Motivation • Few rates of primary production have been measured in the Arctic Ocean • How do rates of production depend on sea ice coverage? 12 10 Ice Extent (106 km2) Image from National Snow and Ice Data Center 8 1978 1993 2011 year
Motivation • Few rates of primary production have been measured in the Arctic Ocean • How do rates of production depend on sea ice coverage? • 2012 had record-low sea ice extent. 2011 was more typical. 2012 Sea Ice Extent Yellow = typical minimum sea ice area Red = study area Image from NASA website
Motivation • Few rates of primary production have been measured in the Arctic Ocean • How do rates of production depend on sea ice coverage? • 2012 had record-low sea ice extent. 2011 was more typical. 2012 Sea Ice Extent We used gas tracers to determine rates of NCP and GPP in mixed layer in Beaufort Gyre in Summer 2011 and 2012 Image from NASA website
Why measure NCP and GPP? • Advantages to concurrent measurements of NCP and GPP • If NCP is low, is it because of low photosynthesis or tightly matched photosynthesis and respiration? • Determine NCP/GPP ratio, analagous to “f-ratio”, a measure of efficiency of biological pump
Gas Tracers for NCP and GPP To calculate NCP: • d(O2/Ar)dt = NCP – gas exchange • Correct for thermal effects by using O2/Argon • Assume steady state and calculate gas exchange
Gas Tracers for NCP and GPP To calculate GPP: • Triple Oxygen Isotopes (16O, 17O, 18O) • Photosynthetic O2: Mass dependentAir: Mass independent • 17D, a measure of the three isotopes, does not change with respiration
NCP in Beaufort Gyre: 2011 vs. 2012 • Rates of mixed layer NCP similar between the two years
GPP in Beaufort Gyre: 2011 vs. 2012 • Rates of mixed layer GPP doubled in the record low sea-ice year of 2012
2011 to 2012 Comparison • Histogram of mixed layer rates of NCP and GPP • Similar distribution for NCP in 2011 and 2012 • Broader range, higher rates for GPP in 2012
2011 to 2012 Comparison • Histogram of mixed layer rates of NCP and GPP • Similar distribution for NCP in 2011 and 2012 • Broader range, higher rates for GPP in 2012
What is Happening? • Higher photosynthetic rates in response to less ice (more light?) but heterotrophs keep up with increase in production • Result: No change in net carbon uptake
What is Happening? • Higher photosynthetic rates in response to less ice (more light?) but heterotrophs keep up with increase in production • Result: No change in net carbon uptake
What is Happening? • Higher photosynthetic rates in response to less ice (more light?) but heterotrophs keep up with increase in production • Result: No change in net carbon uptake • Supporting Data: No rates of respiration were measured but slightly higher bacterial abundances observed in 2012 at the stations that were no longer ice covered (Bill Li, DFO, Canada) Data from Bill Li, DFO
Rates at Depth? Primary Production (mg C m-3 d-1) 0 60 120 0 • NCP and GPP rates only measured in the mixed layer • In the Beaufort Gyre, deep chlorophyll maximum observed and production at depth likely is important • Can roughly scale up mixed layer numbers to whole euphotic zone using depth relations determined from ARCSS-PP Database Depth (m) 50 100 Figure from Arrigo and Dijken 2011
Effect of ice coverage within 2011 • Within the 2011 cruise, regions where higher total ice concentration had • Larger GPP • Similar NCP • Smaller N:G Ratio
Effect of ice coverage within 2011 • Within the 2011 cruise, relationships of GPP and NCP/GPP with ice cover are significant • NCP vs. ice cover not significant • Lots of scatter but implication is that actively melting ice increases GPP but no change in NCP
Conclusions • Summer with record low ice (2012) has higher GPP but similar NCP to more typical summer (2011) • Implication is that as ice continues to decrease, GPP may rise in Beaufort Gyre but NCP may not change no net change in carbon uptake by biological production • Does this occur elsewhere in Arctic? At other times during the year? Time-series would be fantastic!
Acknowledgements • Thanks to • Captain and crew of CCGS Louis S. St-Laurent • Sarah Zimmermann and rest of JOIS/BGOS Team • National Science Foundation, Fisheries and Ocean Canada, WHOI Climate Institute Photo from JOIS Cruise Report
Equations • Equations used to calculate NCP and GPP
Measuring TOI • Measurements are hard to make - cannot be made at sea! • Processing line to remove nitrogen, then measure oxygen isotopes on isotope ratio mass spectrometer • Precision in my lab = 4 per meg
Method: Triple Oxygen Isotopes 17D = ln(d17O/1000+1)-0.52*ln(d18O/1000+1) x106 • Standard is air so by definition 17D of air = 0 • Respiration does not change 17D • Photosynthesis has 17D = 250 per meg (as determined from terrarium experiments by Luz et al (1999), Luz and Barkan (2005) ) Mass Dependent Fractionation Stratosphere Slope = 1.7 MASS INDEPENDENT Respiration Slope = 0.52 ln(d17O/1000+1) Modified after Luz and Barkan, 2005 0 ln(d18O/1000+1)
Method: Triple Oxygen Isotopes 17D = ln(d17O/1000+1)-0.52*ln(d18O/1000+1) x106 • Standard is air so by definition 17D of air = 0 • Respiration does not change 17D • Photosynthesis has 17D = 250 per meg (as determined from terrarium experiments by Luz et al (1999), Luz and Barkan (2005) ) 17D Photo =250 17D Respiration Slope = 0.52 ln(d17O/1000+1) Modified after Luz and Barkan, 2005 17D Air=0 0 ln(d18O/1000+1)
Vocabulary Primer • Gross Primary Production (GPP): Total photosynthetic flux. Base of food chain. • Net Primary Production: Photosynthesis minus autotrophic respiration • Net Community Production (NCP): Photosynthesis minus autotrophic and heterotrophic respiration • New Production: Fueled by input of new nutrients into euphotic zone • Export Production: Flux of organic matter that leaves euphotic zone Over long temporal and spatial scales, NCP, New, and Export Production should be approximately equal.
Why NCP and GPP? • asdasd