Download
1 / 21
210 likes | 365 Vues
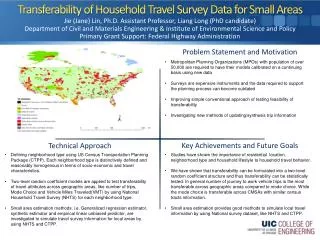
Estimating Frequency of Travel to Endemic Areas. Brian Custer, PhD, MPH Blood Systems Research Institute Blood Products Advisory Committee Meeting August 2, 2011. Map of Current Service Area and Focus of this Presentation. AR. Donor Registration Record (DRR). All centers

E N D
Estimating Frequency of Travel to Endemic Areas Brian Custer, PhD, MPH Blood Systems Research Institute Blood Products Advisory Committee Meeting August 2, 2011
Map of Current Service Area and Focus of this Presentation AR
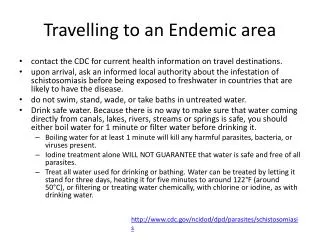
Donor Registration Record (DRR) All centers 1. Prospective donors asked to provide race/ethnicity and country of birth UBS centers (excluding Central Coast) 2. Additional questions a. Have you spent time that adds up to 3 months or more in Mexico, Central America or South America? b. Has your mother spent time that adds up to 3 months or more in Mexico, Central America or South America? c. Since your last donation have you traveled to Mexico, Central America or South America? Response Options: 1. No 2. Mexico 3. Central America and/or South America 4. Both Mexico and Central and/or South America 5. No Answer or Refused 6. Unknown
Data Sources and Time Periods Universal Testing for T. cruzi by Ortho EIA (January 2007 – April 2010) Repeat Reactive (RR) donations are tested using RIPA 1-time selective testing after April 2010 except for UBS Central Coast as part of Chagas Incidence Study Protocol Pre-donation questions of donors at UBS centers February 2007 – May 2011 Overlap of universal testing and pre-donation questions during the period of February 2007 – April 2010 at the UBS Centers
Prevalence by Country of Birth All BSI Centers (1/2007 – 12/2009)
T. cruzi EIA Results by State - Repeat Donors(2/2007 – 4/2010)
T. cruzi EIA Results by State – First Time Donors(2/2007 – 4/2010)
Repeat Donors3 Months or More in an Endemic Area(2/2007 – 4/2010)
First Time Donors3 Months or More in an Endemic Area(2/2007 – 4/2010)
Travel Since Last Donation in Repeat Donors Includes All Donations (2/2007 – 4/2010)
Travel Since Last Donation in Repeat Donors Analyzed as Donations(2/2007 – 4/2010)
T. cruzi EIA Results by State - Repeat Donors with Travel(2/2007 – 4/2010)
Unconfirmed EIA (False Positive?) by Area of Travel– Repeat Donors(2/2007 – 4/2010)
Example Donor with High Travel to MexicoEIA s/co Results and Donation/Sample Dates RIPA Negative at both time points Interval with travel
Travel by State of Residence • Overall, 97% of repeat donors report no travel to endemic areas for T. cruzi • Proportion of donors traveling by state is variable • ~ 6% of repeat donors in Texas report travel since last donation • 98% of which is to Mexico • Under 1% of repeat donors from Mississippi report travel since last donation • 84% of which is to Mexico
Summary Period of January 2007 – April 2010 at UBS Centers: • 243 EIA positive donations 145 repeat donations 98 first time donations • 59 RIPA positive donations 17 repeat donors (first time screened) • No previously tested repeat donors reporting travel were RIPA positive • No previously tested repeat donors were newly RIPA positive 42 first time donations 3) Proportion of apparent False Positives (~1:15,000) is the similar for donors who do and do not report travel to endemic areas since last donation
Summary • Over 400,000 interdonation interval person-years accumulated included travel to endemic areas. • 4 Donors with travel to Mexico were newly EIA RR • All four were RIPA negative • 3 were RIPA negative on an additional follow-up sample • We do not see evidence of incident infection in donors with travel and the proportion of apparent false positive EIA results is similar to that observed for donors who did not report travel
Acknowledgements • Roberta Bruhn • Mike Busch • Hany Kamel • Marj Bravo • Karen Ofafa • Peter Tomasulo