Benchmarking C3-SNHT Application for Enhanced Climate Data Homogeneity
50 likes | 168 Vues
The Enric Aguilar Center for Climate Change at Universitat Rovira i Virgili has developed a new software application for the COST-HOME monthly benchmark of climate data, utilizing the C3-SNHT method. This fully automatic system detects and corrects data breaks, significantly improving the homogeneity of climate observation networks. It employs reference selection methods, runs quickly with bash scripting, and is capable of generating correction patterns based on substantial data analysis. While human validation post-application enhances the reliability of detected breaks, the initial automated process represents a promising step forward in climate data accuracy.

Benchmarking C3-SNHT Application for Enhanced Climate Data Homogeneity
E N D
Presentation Transcript
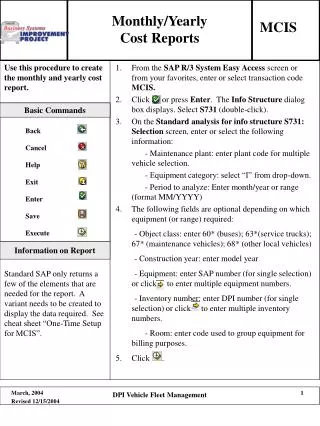
Enric Aguilar Center for Climate Change, C3, Geography Department, Universitat Rovira i Virgili de Tarragona, SPAIN COST-HOME Monthly Benchmark
C3-SNHT APPLICATION • New software (F95). • Detection and taylored correction modules • Reference selection (distance, correlation, overlap) • One homogenization for station: for each station/element/month-season-annual a special “network” is created and only the results for the main candidate are retained • Series are split until the most recent break is found • It the break is significant and larger than large enough, is retained • If the break is non significant or too small, it is retained • In both cases, if the rest of the series is big enough (i.e. more than X values) the rest of the series is tested) • Breaks need to be inspected and a correction pattern created. This is better done with annual and seasonal averages
OVER THE BENCHMARK • For the benchmark analysis, the less costly procedure (in time has been selected). This is far from the optimal application of the C3 software, but can assess if – even with this scope – he homogeneity of the networks increases or not. • Fully automatic application. No human intervention, only parameters set up (significance level, minimum segment to test, outliers level, minimum factor to consider, etc.) • Each network runs very quick, with a single bash script • R code for results control • No trend detection in automatic mode (although trends are identified and corrected as small, same sign consecutive break)
OVER THE BENCHMARK (II) • Calculation of annual averages • Detection over annual averages (cannot trap some breaks with seasonal cycle) • Creation of correction pattern with breaks detected in annual averages (all breaks assigned to January) • With real datasets, human inspection would be needed after automatic run: • To validate breaks (you know, all that story about metadata ) • To identify trends • To better assign the validated breaks (year/month)
CONCLUSIONS • The very simplified automatic procedure applied to run the benchmark networks seems to improve tho homogeneity of the network • Benchmark results analysis (specially when breakpoint positions, amplitudes, etc. are disclosed) must help to improve the automatic detection • Human intervention improves the detection... usually ;-)