Analyzing Profitability Margins: Microsoft and Industry Comparisons
160 likes | 292 Vues
This resource provides a comprehensive analysis of profitability margins for businesses, particularly focusing on Microsoft. It includes calculations for Gross and Net Profit Margins, an examination of trends over time, and a comparative analysis against competitors such as Apple and Amazon. Additionally, it addresses the implications of increasing or decreasing profit margins and their effects on revenue and costs. By employing financial ratios, this analysis aids stakeholders in making informed decisions and assessing the overall financial performance of various companies.

Analyzing Profitability Margins: Microsoft and Industry Comparisons
E N D
Presentation Transcript
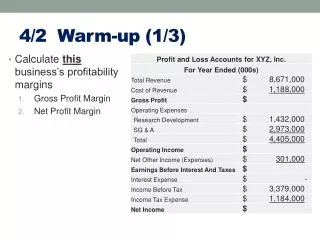
4/2 Warm-up (1/3) • Calculate thisbusiness’s profitability margins • Gross Profit Margin • Net Profit Margin
4/2 Warm-up (2/3) • Calculate this business’s profitability margins • Gross Profit Margin • Net Profit Margin
4/2 Warm-up (3/3) • Comment on the Profitability of the businesses (XYZ vs. ABC)
4/3 Warm-up • If a business is experiencing DECREASING profit margins, what can be said about the relationship between Revenue & Costs? • If a business is experiencing INCREASINGprofit margins, what can be said about the relationship between Revenue & Costs?
Microsoft’s Margins • Gross Profit Margin • 1996 = 86.3% • 2011 = 77.7% • Net Profit Margin • 1996 = 35.5% • 2011 = 38.8%
What’s Happening to Microsoft & Why? Marketing External Environment Strategy Operations Finance
Microsoft ArticleExplicit & Implicit • EXTERNALfactors impacting Microsoft • Competitors • External environment (PEST) • Microsoft STRATEGIES • Response to external factors • Microsoft MARKETING • Satisfying customer’s needs • Microsoft OPERATIONS • Resources & processes to satisfy customers. • Microsoft FINANCE • Working Capital • Capital Expenditures
4/4 Quiz • Identify where you can find the following information (Income Statement or Balance Sheet) • Total value of Equipment & Property • Total amount of Debt owed • Total amount of revenue generated • Total amount of Interest Paid • Total amount of Retained Profit • Total amount of Cash on hand • Total amount Owed by Customers (Debtors) • Total amount Owed to Suppliers (Trade Credit) • Total spent to make products sold • Total value of Stock (inventory) on hand • Total amount of capital invested by owners
Objective • Calculate financial ratios for a business using the Profit & Loss Account (Income Statement) and Balance Sheet • Interpret the financial performance of a business using Ratio Analysis • Analyze the impact of strategic decisions on the core functions of a business; • Marketing • Operations • Finance
Businesses • Amazon • AMR Corporation (American Airlines) • Apple • Boeing • Google • JC Penney • Nordstroms • Southwest Airlines • Starbucks
Purpose of Ratio Analysis • To analyze financial position • Liquidity situation? • Adequate amount of debt? • To assess performance • Revenue growing? • Costs under control? • Compare performance against projections • Aid stakeholders in their decision making
How To Use Financial Ratios Historical Comparisons Inter-firm Comparisons Compare similar business’s in the same industry Assess the firm’s relative performance • Look at firm’s ratios over time • Identify trends • Assess performance over time
Calculating Ratios • Revenue Growth • Profitability Ratios • Gross Profit Margin • Net Profit Margin • Liquidity Ratios • Current • Acid Test • Efficiency Ratios • Stock Turnover (# times, # days) • Return on Capital Employed • Debt Load (Risk) • Gearing (aka “Leverage”)
Group Warm-up • How can the Profitability Ratios be used to determine the % of revenue used for paying operating costs; • Cost of Revenue? • Expenses? GPM = Gross Profit Margin (Gross Profit / Revenue) NPM = Net Profit Margin (EBIT / Revenue)
Ratio Analysis Wrap-up • Work in your groups, discuss the financial performance of each company. • Rank the companies according to their investment potential & explain why. • Top = companies your group would invest in • Bottom = companies your group would not invest in • What other information would you consider before making an investment?